Creon Levit, a 32 year veteran of NASA and now director of R&D at Earth observation satellite swarm operator Planet Labs, recently decided to do his own independent assessment of long term climate change using raw data collected directly from thermometers installed in airports around the world. The results are now published in “Hot or Not? Visualizing temperatures around the world over the last 75–100 years” and are well worth perusing.
I wanted to find long-term temperature records. From thermometers. Not from proxies (tree rings, ice cores, etc). It turns out thermometers are not that hard to make, and they have been around for a while.
The data source I focused on is the “Automated Surface Observation System” (ASOS). It is a worldwide database of (approximately) hourly temperature data from airports. Many hundreds of airports. Some of the airports’ data series are only a few years old, but some have been recorded since the dawn of commercial aviation - since the 1920s.
(ASOS records hourly temperature, wind speed, and humidity - which is what pilots need to know to decide whether they can take off or not. I just looked at temperature).
I focused on the “longest duration” ASOS timeseries: 75, 85, or more years old.
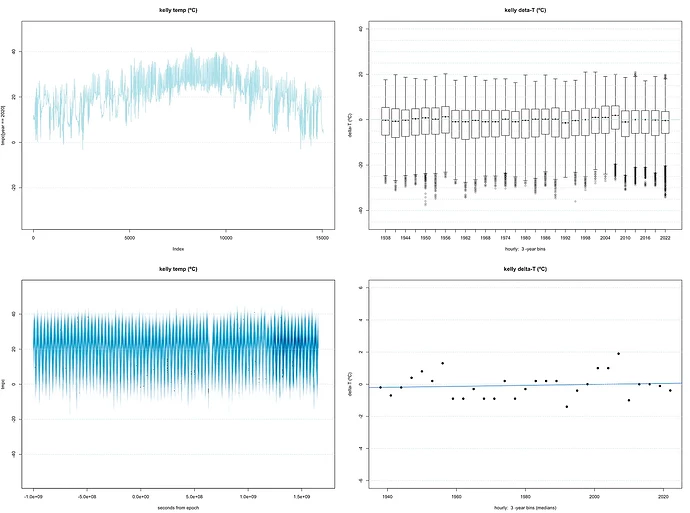
The results are from all over the world. Here is Kelly, Texas, for which more than 80 years of data are available.
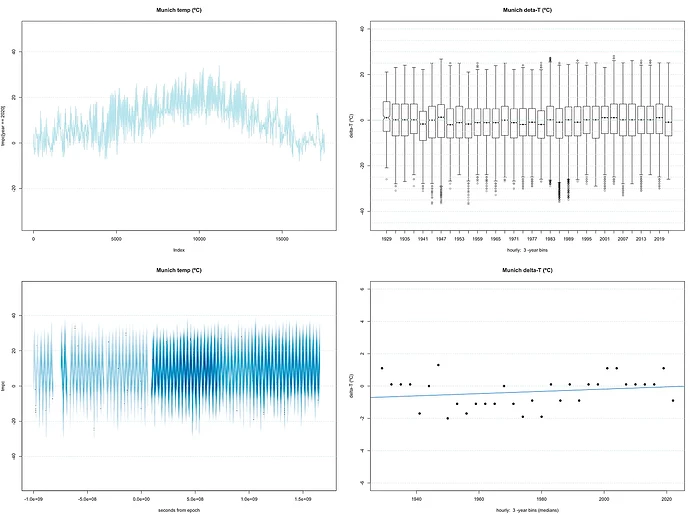
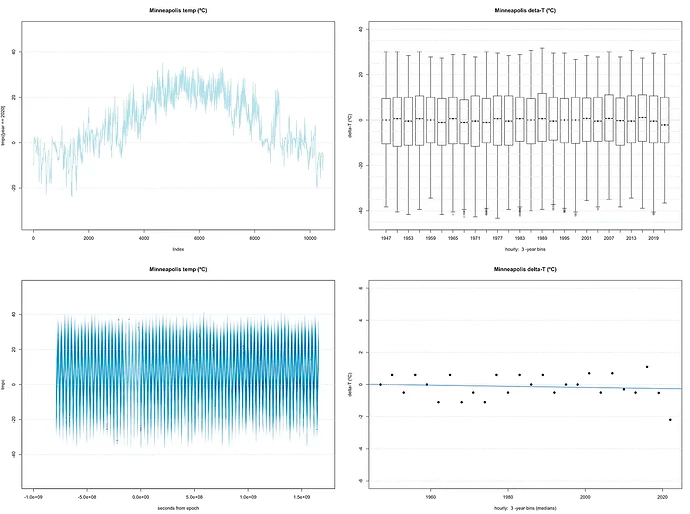
The top left chart is hourly data for 2020 as a reality check. You can see daily and seasonal variation of temperature. Bottom left is the entire data series of hourly measurements. Top right summarises the hourly data in three year bins, showing medians, quartiles, and extrema. Finally, the bottom right plots the medians with a linear least squares fit to the points.
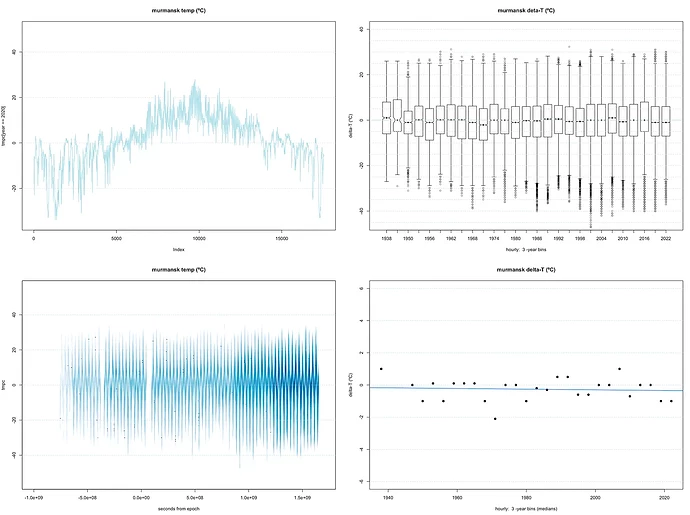
Here is Murmansk, Russia, where the arctic climate is expected to show pronounced warming.
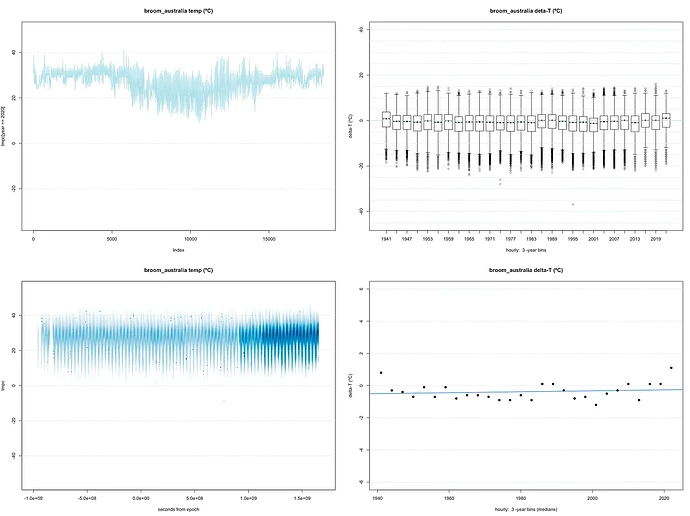
In the southern hemisphere, here is a site in Australia.
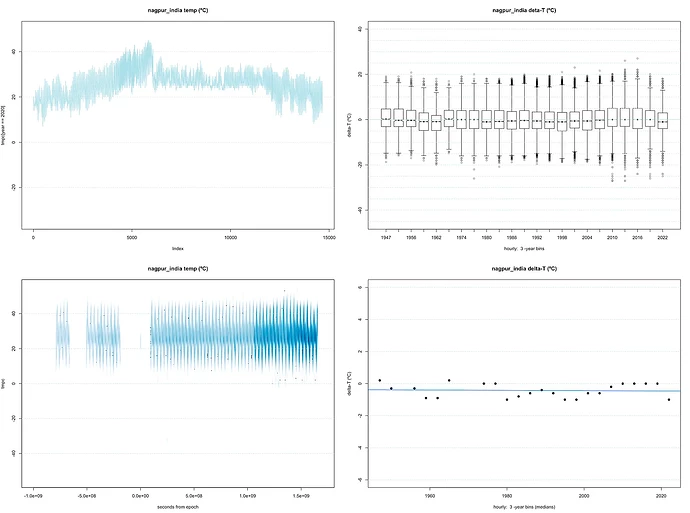
We’ve all heard how India is suffering from climate change. Well, let’s see.
Munich, Germany:
Minneapolis, Minnesota:
Creon concludes:
When I look, I see two big things: 1) The annual extremes at each location span a much larger range of temperatures than any slow wandering of the median temperatures over almost a century. And 2) the series of medians (and the minima and maxima) look pretty close to random walks.
Do these data confirm the existence of a climate crisis? A “planetary emergency”? An existential threat to human civilization, the human race, or the biosphere? Let me know what you think.
