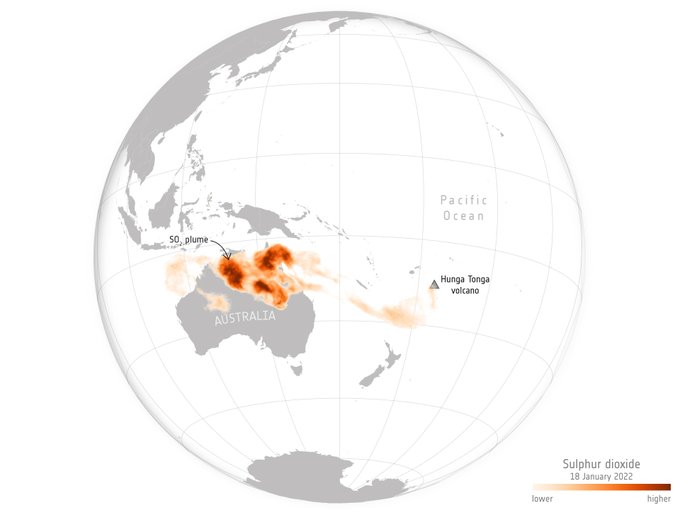
Here is a global image showing the propagation of the pressure wave from the volcanic explosion. This is a Twitter animated image which cannot be embedded: click the link to view.
Building on the calculations in comments 7 and 18, I performed a similar analysis on the propagation of the first wave signal around the world reported from New Zealand in comment 19.
Absent exact numbers, I eyeballed the chart and estimated the arrival of the first wave on 2022-01-15 at 20:00 UTC and return of the first wave after circumnavigation on 2022-01-17 at 07:20 UTC, for a propagation time of 35.33 hours. I then calculated the velocity in both metres per second and nominal Mach units with Units Calculator:
(earthradius 2 pi) / (35.33 hour) = 314.73281 metre/second
(earthradius 2 pi) / (35.33 hour) = 0.94953481 mach
where
mach = 331.46 metre/second
which is the definition in GNU Units for the speed of sound in dry air at standard temperature and pressure.
Given the uncertainties of propagation around the globe and time measurement from the graph, this seems a perfectly reasonable value.
You’d expect the propagation speed to be somewhat less than it is at standard temperature and pressure (STP) since the sound channel is at some nontrivial altitude where the temperature, and hence the speed of sound, is less than it is at sea level. Sound is lazy; it bends toward the slower regions. Just as there’s a sound channel deep in the ocean, so there is one in the atmosphere. Wind and temperature gradients also affect the propagation of sound. All of which is to say that one would expect the average speed of propagation to be less than the speed of sound at STP, though it’s complicated to work out exactly what it would be.
“Standard temperature and pressure” (STP) is defined (since 1982, trivially different before) as 0 °C and 100 kPa (essentially, one atmosphere). But this isn’t really “standard” outside of polar regions, since at sea level the average temperature is greater than freezing.
Given the uncertainties about the altitude at which the pressure wave propagated (which doubtless varied substantially as it went around the globe) and the temperature along its path (plus humidity, which also gets into the speed of sound game), I was just satisfied it came out so close to the “around 300 metres per second” that Kerbal Space Program trains players to expect.
This is an update from GeologyHub which shows some early radar imagery that appears to show the bridge between the two islands and much of the islands themselves were blown away in the explosion. It then presents an analysis which concludes the based upon sulfur dioxide emissions this was likely a Volcano Explosivity Index (VEI) 4 or low 5 event. The estimates of a higher index based upon the size of the immediate explosive plume may not have taken into account the effect of seawater turned to vapour in the underwater eruption, which increased the plume height from which VEI is often estimated.
Here is a news report from Newshub in New Zealand about damage in Tonga and relief efforts being staged from Australia and New Zealand.
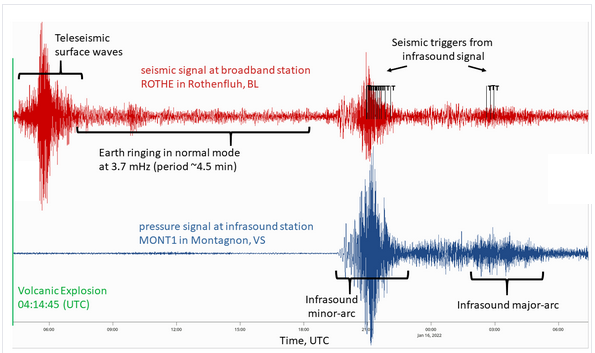
The Swiss Seismological Service detected both the seismic waves from the Tonga eruption and the infrasonic atmospheric pressure wave on both its primary arrival, arrival along the long arc around the Earth, and on subsequent circlings of the globe.

The massive submarine eruption of the Hunga-Tonga-Hunga-Ha’apai volcano in the South Pacific on 15 January 2022 was registered by the seismic stations of the Swiss Seismological Service at ETH Zurich (SED). The volcanic explosion began at 05:14 Swiss time and generated seismic waves equivalent to a magnitude 5.8 earthquake. Seismic body waves reached the Swiss seismic network around 20 minutes later, having passed directly through the Earth. Body waves propagate at speeds of 5–10 km/second (36,000 km/h). Another 30 minutes later, seismic surface waves – which travel more slowly – also reached Switzerland. The Swiss network continued to record the Earth ‘ringing’ in normal mode for more than 12 hours after the surface waves had subsided. This is where the Earth vibrates at characteristic frequencies determined by its internal structure. These vibrations, with a period of approximately 4.5 minutes, were also observed after the eruption of the Philippine volcano Mount Pinatubo in 1991.
Such volcanic explosions also create pressure waves in the atmosphere, as described in this MeteoSwiss blog (in German). Infrasound waves, which have frequencies below the lower limit of human audibility (between approximately 15 Hz and 0.001 Hz), are only slightly attenuated in the atmosphere and can be measured over very long distances. Infrasound travels at a speed of around 1,200 km/h. These waves showed up clearly on the SED’s highly sensitive broadband monitoring stations and on SED-operated infrasound sensors from around 20:30 Swiss time, a little over 15 hours after the seismic waves reached Switzerland. The dispersion of these infrasound waves (i.e. the way their propagation velocity depends on their frequency) can also be clearly seen, with low frequencies propagating slightly faster and arriving first, followed by progressively higher frequencies. An initial period of strong signals lasting a good two hours was caused by the waves that reached us directly. Around five hours later, the signals that propagated in the opposite direction can be seen, with significantly smaller amplitudes. Another spike was observed on the morning of 17 January as the waves circled the Earth for a second time. The infrasound signals caused a number of false seismic triggers during automatic data processing at the seismic monitoring stations.

Perhaps AU and NZ will stock up on seaplanes for such relief missions.

