
Am I reading the student loan graph correctly? Female borrowers have a higher principal balance?
It looks like the graph is normalized to 100% being each individual student’s cumulative borrowing at the time of graduation. Female students on average seem to be paying off the student loan at less than the rate at which interest is accumulating, such that their debt on average increases to 110% of the initial amount.
Remember that the majority of students at college level are now female. Either they are (on average) being financially irresponsible when they enter the work force – or they are not earning enough to pay off the loan.
It is another reason for males to avoid marrying college-educated (indoctrinated) females. Fortunately, there are lots of unburdened Ukrainian women who will now never find a husband at home.
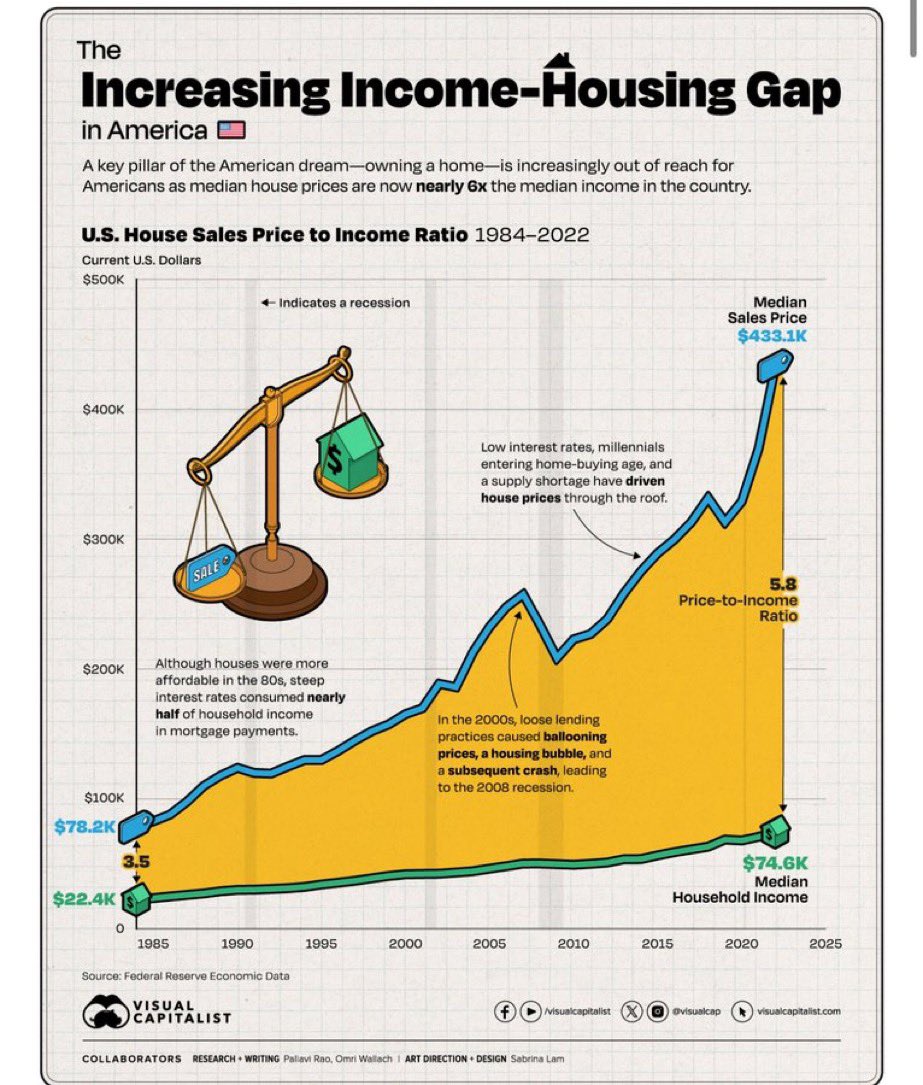
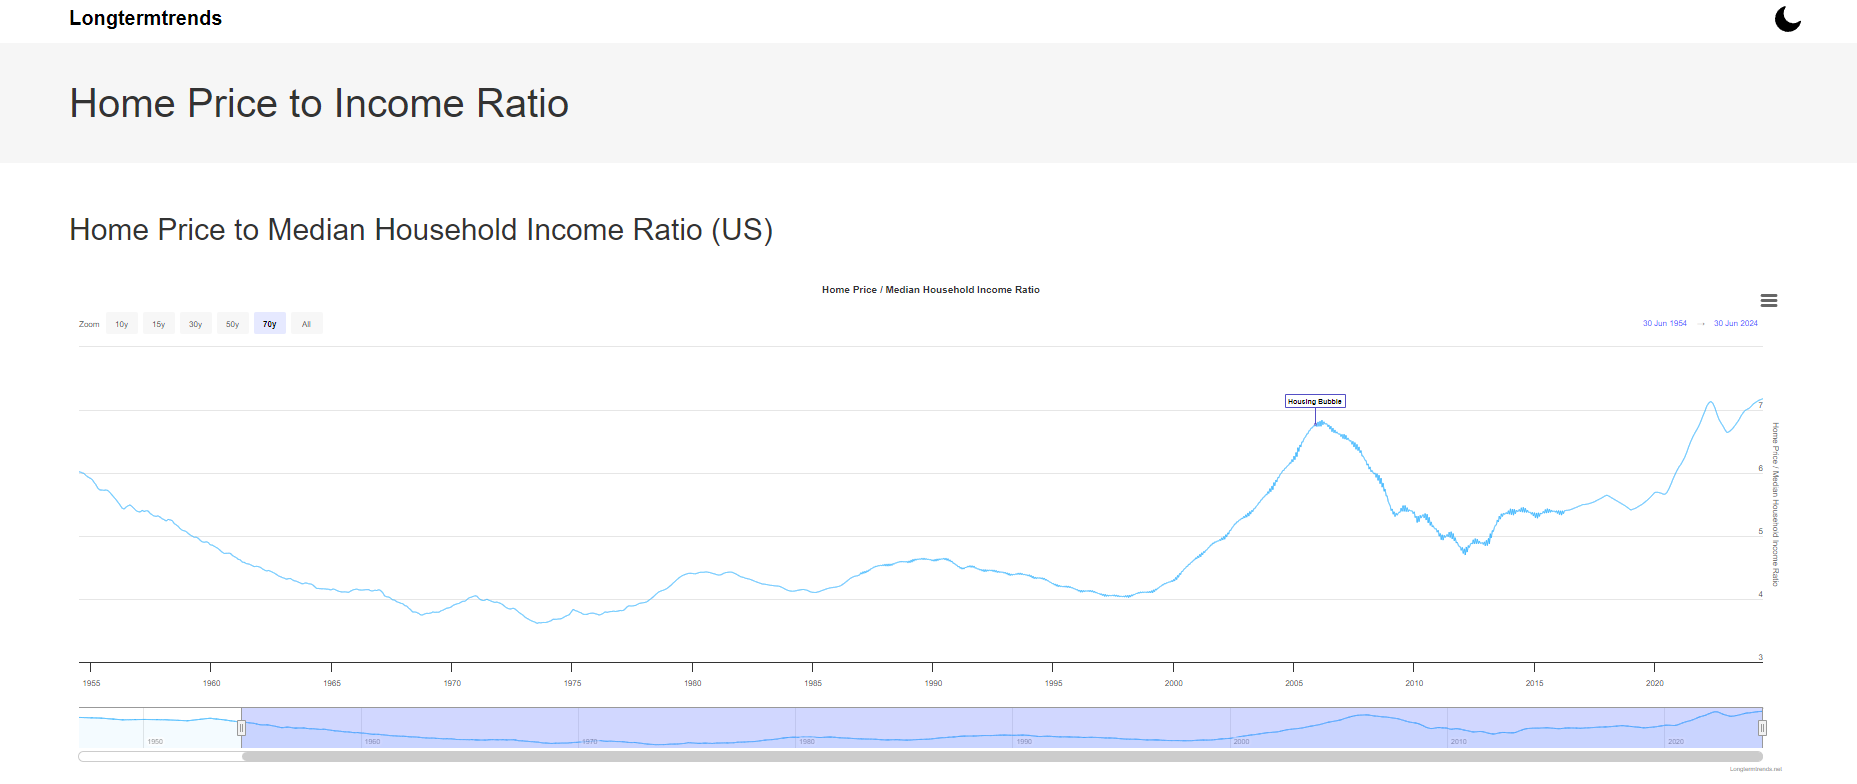
I can’t see how these real estate prices are sustainable. Am I missing something?
A hypothesis: the ratio of 5.8 is comparing two different populations.
Median household income includes ALL households – including those who cannot afford to buy a house.
Median [house] sales price reflects only what the high-earning SUBSET of those households who can afford to buy houses actually pay.
In blunt terms, the ratio is distorted by the existence of home-buying by a large number of government/para-government workers with higher than average incomes and total job security. The slogan should have been: “Non-government workers of the world Unite!”
I wonder how much of the disparity is due to changing lifestyle preferences or materialism. Since 1985, the average size of a new U.S. home has grown from ~1700 square feet to over 2500 square feet. I would also guess that a greater fraction of houses today are purchased in expensive urban areas or suburbs, even while smaller, less expensive rural homes are available.
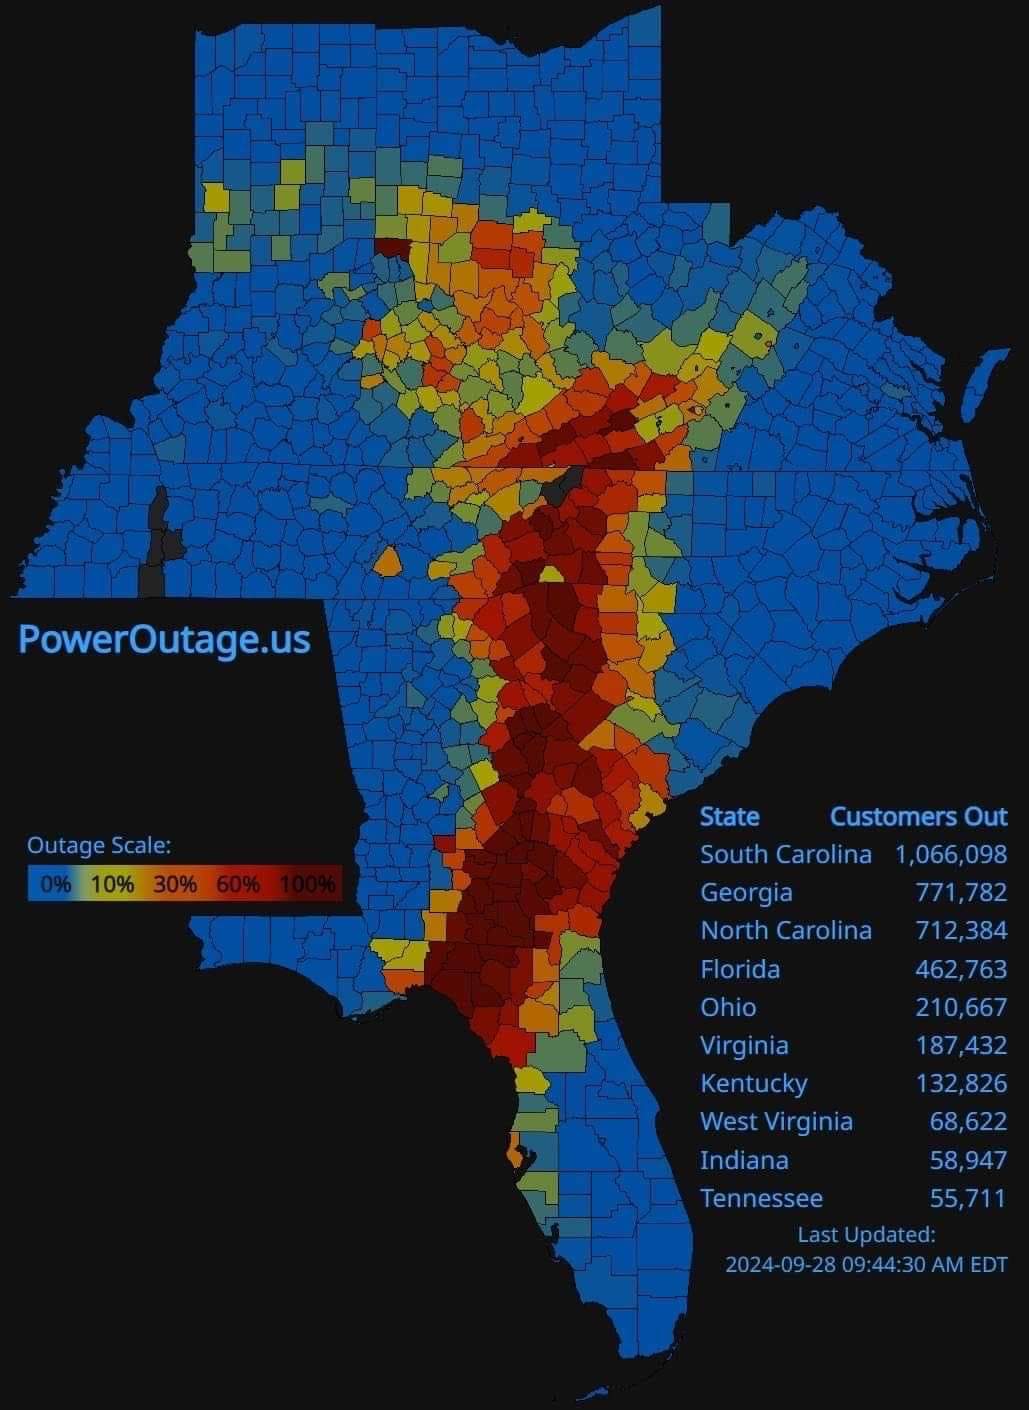
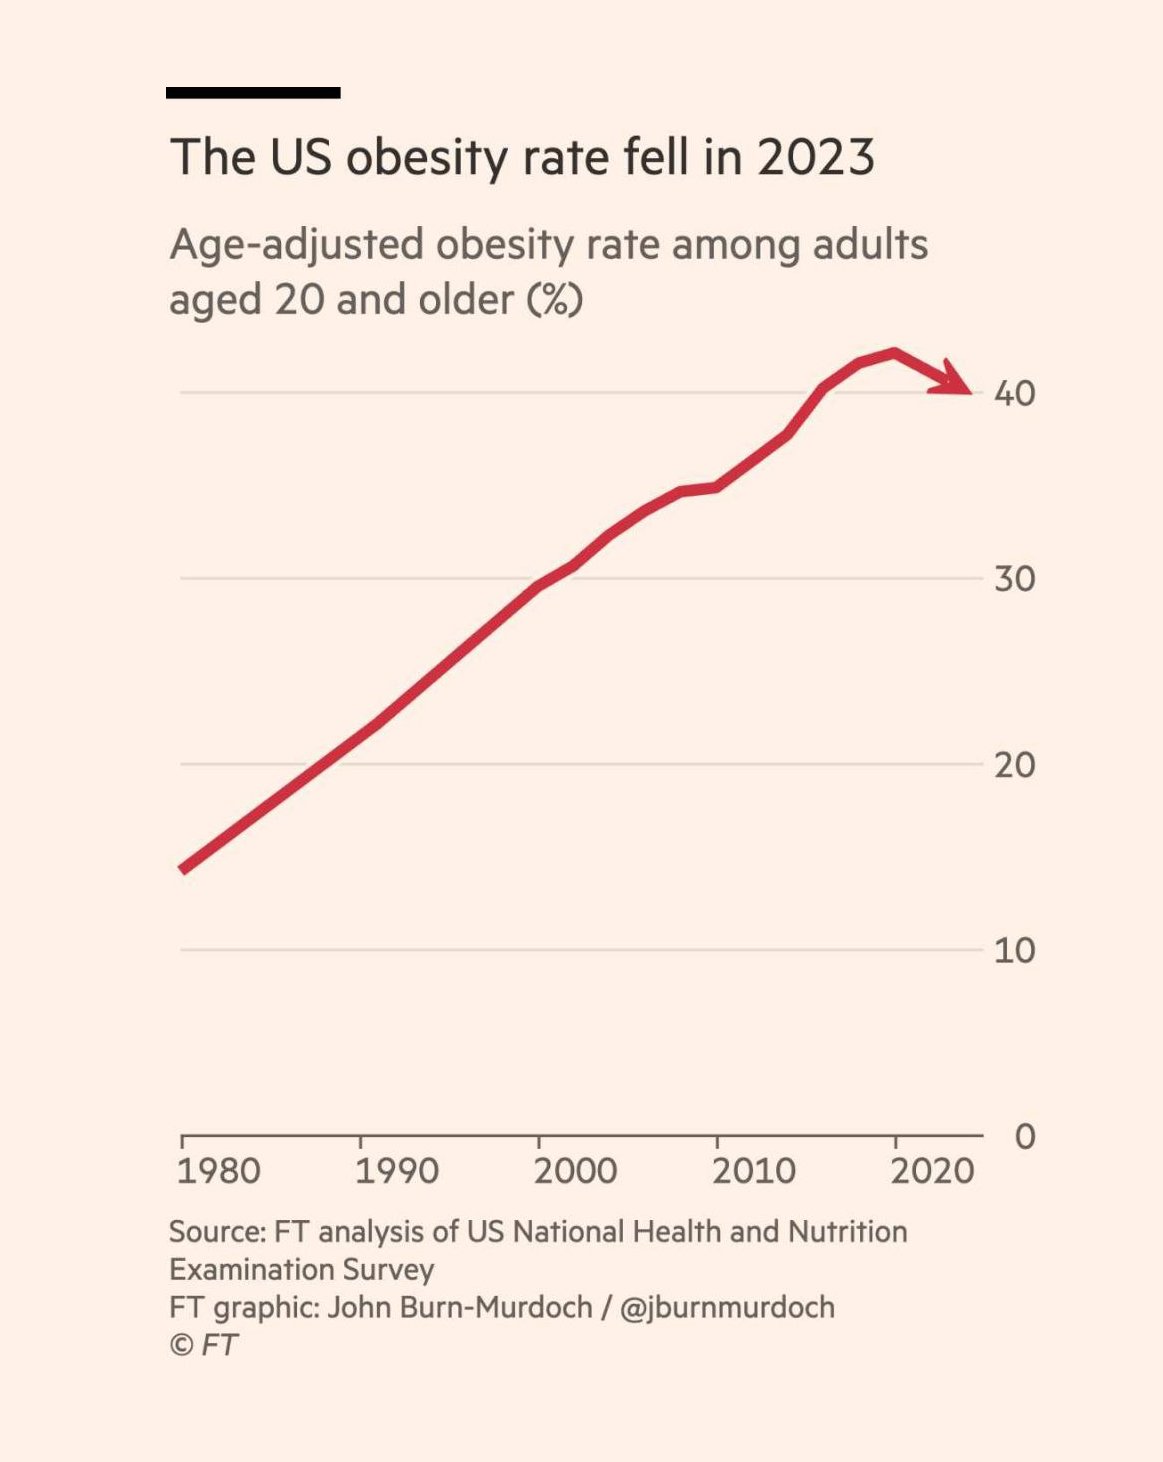
Relevant to JD Vance’s response at the debate regarding school shootings in the US.

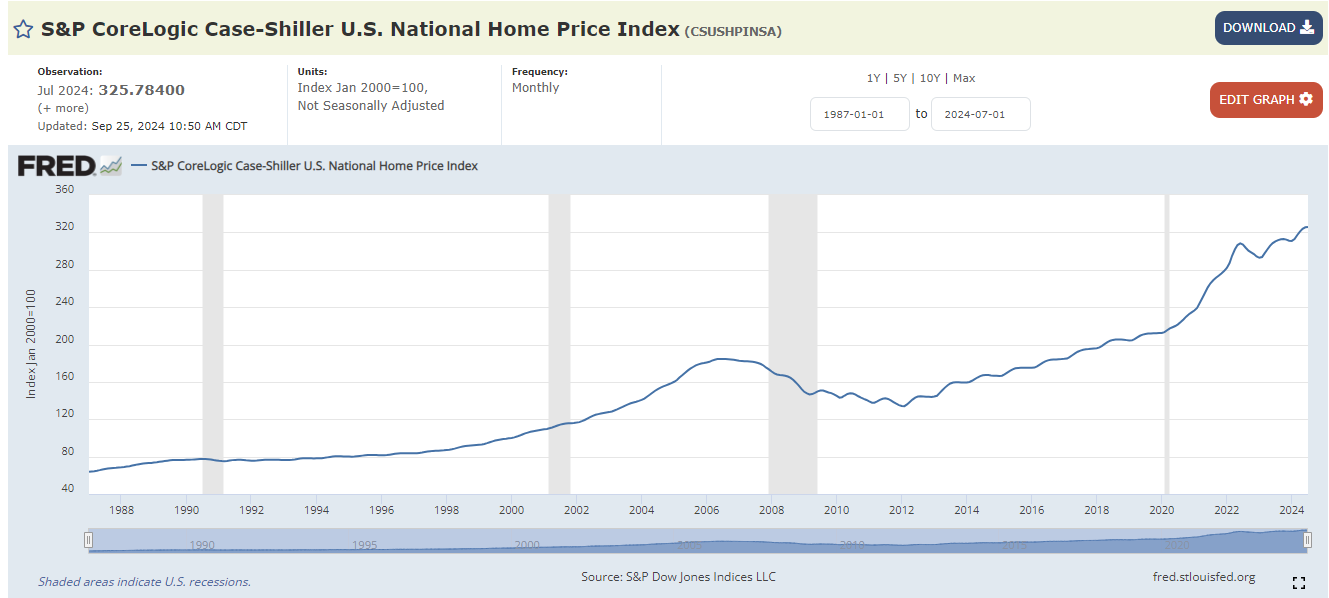
From Jan 1988 to Jan 2020 the Case-Shiller price index increased at a pace of 3.2%.
I think the following graph provides a better look at housing prices.
Some things that possibly contribute:
- The housing bubble driven by low interest rates and government demanding that lending standards be reduced never fully corrected.
- Median household income includes all households whether it be a couple or a single individual. I suspect the postponement of marriage has impacted housing prices in two ways. One the household income will be lower than when marriage happened sooner with both people working and less marriage increases demand for housing.
-I don’t know if there is any data collected that is corrected for marriage rates and percent of married households with both working. - Houses have gotten larger as you noted.
- Amenities. Our home is under median price in our area and it has several things our first home did not have including a fireplace, three stall garage, granite countertops, a deck, a porch, hardwood floors, ceramic tile floors and baths, automatic sprinkler system, etc. This maybe reflects what Gavin noted that homes are more often being purchased by higher income couples.
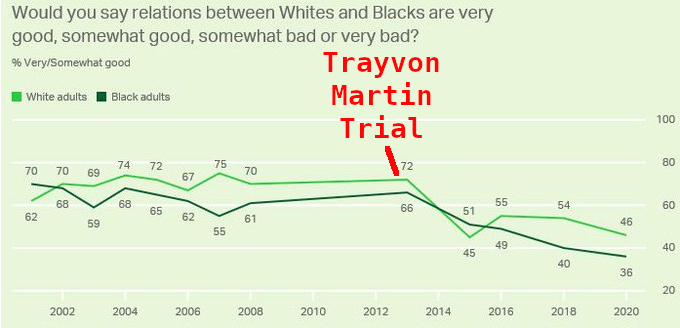
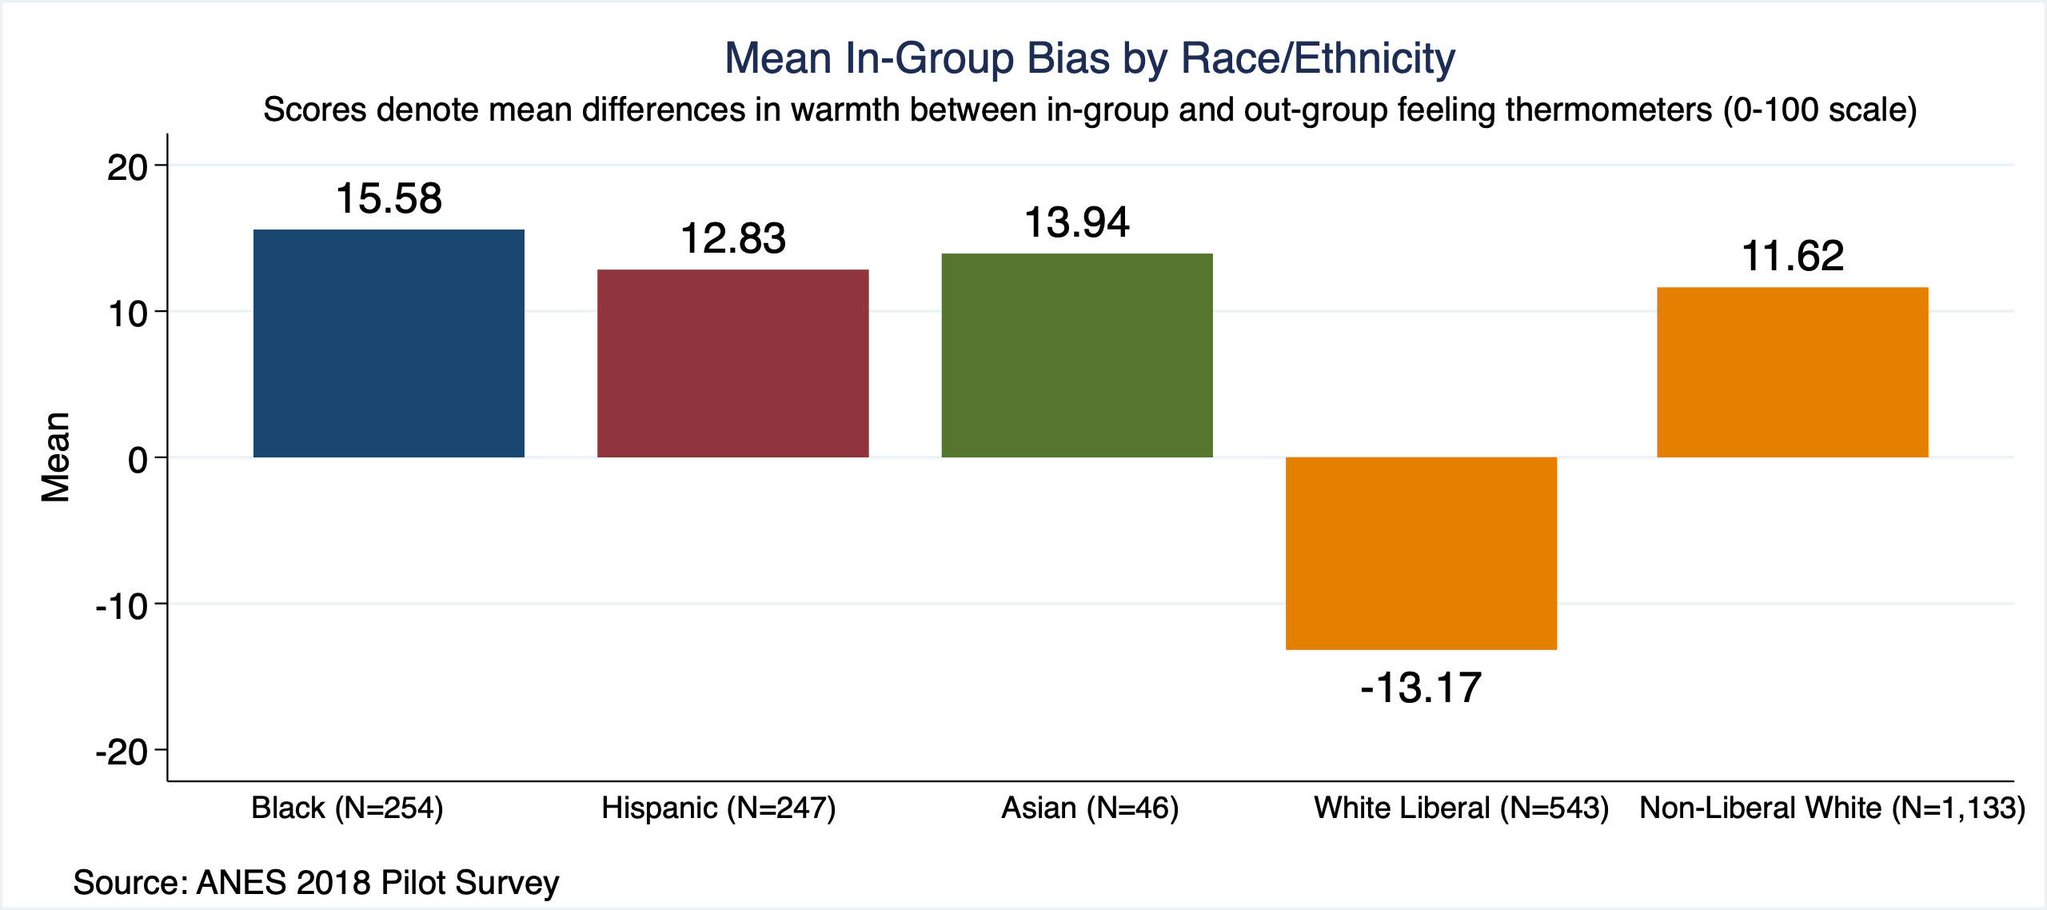
BLM gained a lot of traction in 2014 after Trayvon. Heather MacDonald wrote editorials about the war on police.
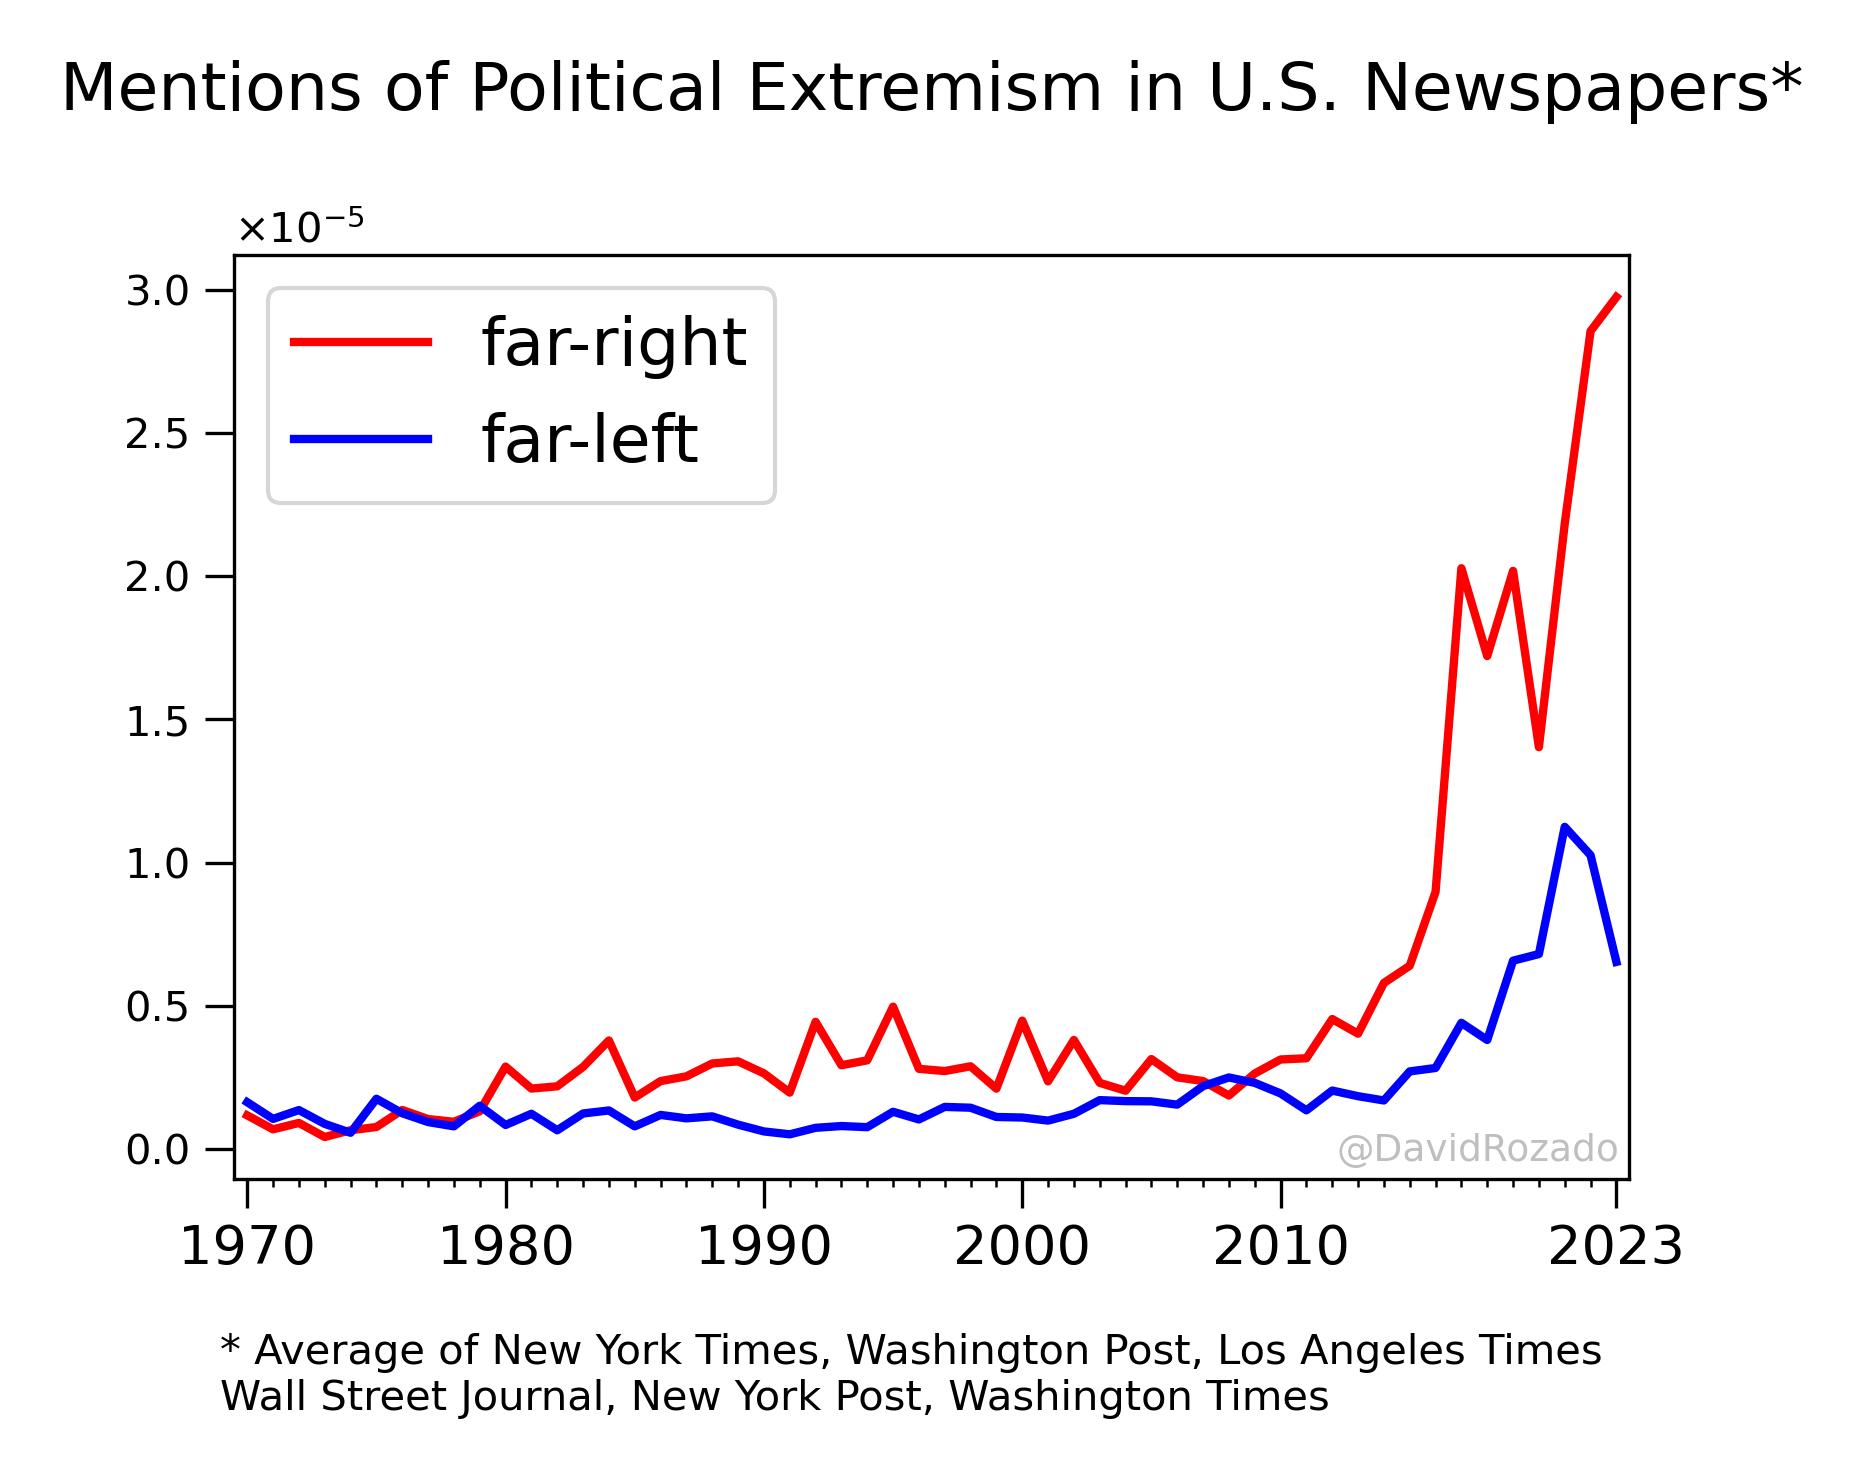
I can’t remember seeing the phrase “far left”. The term far right has no definition unless it covers all conservatives. Moderate is used to describe Rino and white working class Democrats like Scranton Joe. Another lie like middle class Kamala. Her mother was born in India, her family was Tamil Brahmin. I think I read this on Wikipedia, I wonder if it has been scrubbed
I remember reading several articles a decade ago maybe longer about which factors are correlated with house price and the two biggest are square footage and number of bathrooms. Obviously square footage and number of bathrooms have a lot of overlap, they are confounding variables