Aliens who observed our world from afar might think it odd that so many of its inhabitants call it something that translates to “Earth”. Curious, because the most striking feature of the planet, unique in the solar system, are the oceans that cover more than 70% of its surface. Or more precisely, ocean, since all of the oceans are connected into one continuous body of water, with their conventional names social constructs since people like to make distinctions.
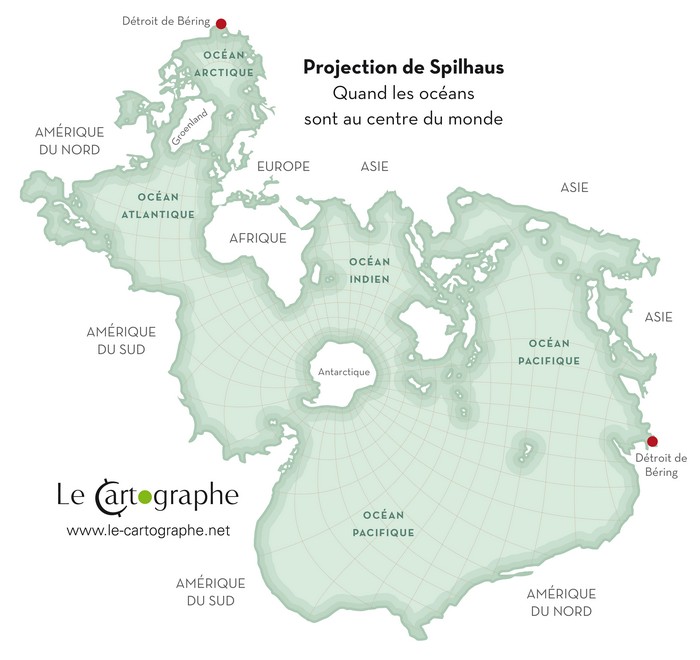
In 1942, the endlessly creative Athelstan Spilhaus, whose professional career included research in oceanography, invented a new map projection which placed the world ocean at the centre and showed its unity. This is a conformal projection, centred on Antarctica, which relegates the coastlines of land masses to the edges and accepts distortion of them in the interest of showing the ocean to scale. The red dot shows the connection between the Arctic and Pacific oceans at the Bering Strait, indicating the map wraps at that point.
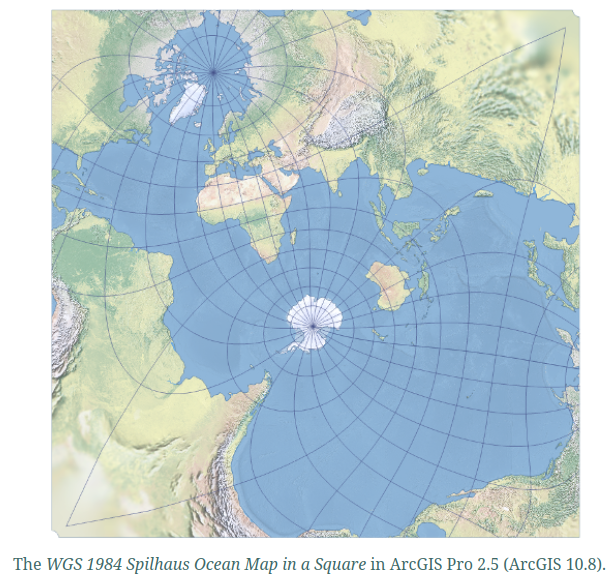
Spilhaus never published full details of the mathematics behind his map projection, leaving some ambiguity in how it was defined. In 2020, Esri (Environmental Systems Research Institute), developer of geographic information system (GIS) software, researched appearances of the Spilhaus projection and other “world in a square” maps and reverse engineered it develop parameters for their ArcGIS software which will closely reproduce it. Details of this investigation and the projection they developed are in the 2020 Esri publication “The Spilhaus World Ocean Map in a Square”. Here is the Spilhaus map as rendered by ArcGIS, showing details of the land masses adjacent to the ocean.