A paper published in the February 2022 issue of Health Physics, “World Atmospheric CO₂, Its 14C Specific Activity, Non-fossil Component, Anthropogenic Fossil Component, and Emissions (1750–2018)” (full text at the link), uses the fraction of carbon dioxide in the Earth’s atmosphere containing the carbon-14 (C-14) isotope to disentangle the contribution of human (anthropogenic) activity from other sources of atmospheric CO₂ over the period in which fossil fuel burning has been a major contributor to human energy sources. Here is the abstract:
After 1750 and the onset of the industrial revolution, the anthropogenic fossil component and the non-fossil component in the total atmospheric CO2 concentration, C(t), began to increase. Despite the lack of knowledge of these two components, claims that all or most of the increase in C(t) since 1800 has been due to the anthropogenic fossil component have continued since they began in 1960 with “Keeling Curve: Increase in CO₂ from burning fossil fuel.” Data and plots of annual anthropogenic fossil CO₂ emissions and concentrations, C(t), published by the Energy Information Administration, are expanded in this paper. Additions include annual mean values in 1750 through 2018 of the 14C specific activity, concentrations of the two components, and their changes from values in 1750. The specific activity of 14C in the atmosphere gets reduced by a dilution effect when fossil CO₂, which is devoid of 14C, enters the atmosphere. We have used the results of this effect to quantify the two components. All results covering the period from 1750 through 2018 are listed in a table and plotted in figures. These results negate claims that the increase in C(t) since 1800 has been dominated by the increase of the anthropogenic fossil component. We determined that in 2018, atmospheric anthropogenic fossil CO₂ represented 23% of the total emissions since 1750 with the remaining 77% in the exchange reservoirs. Our results show that the percentage of the total CO₂ due to the use of fossil fuels from 1750 to 2018 increased from 0% in 1750 to 12% in 2018, much too low to be the cause of global warming.
The key observation underlying this research is that while the carbon in atmospheric carbon dioxide has a component of around one part per trillion of the carbon-14 isotope, mostly formed by cosmic ray interactions with atmospheric nitrogen through the process:
since carbon-14 beta decays back to nitrogen:
with a half-life of 5730 years, essentially all of the carbon-14 present in fossil fuels when they were formed has decayed, so when they are burned and the resulting CO₂ released into the atmosphere, their contribution to atmospheric carbon-14 is zero, and consequently dilutes the natural C-14 fraction. This can be used as a marker for the fraction of atmospheric CO₂ due to human use of fossil fuels.
This analysis is complicated by an increase in atmospheric C-14 due to atmospheric nuclear weapons tests, mostly between 1955 and 1963. Nuclear weapon detonations emit prodigious quantities of neutrons which interact with atmospheric nitrogen through the same process as cosmic rays, producing C-14. This caused a spike in atmospheric C-14 which is observed in the data, but by the 1980s most of the C-14 from nuclear testing had been absorbed in the oceans and land biosphere, leaving only a small residual increase in the atmosphere.
After controlling for these and other factors, the authors find that as of 2018, CO₂ added to the atmosphere by human activity accounted for only 23% of CO₂ since 1750, and that the fraction of anthropogenic CO₂ in the atmosphere had risen from 0% in 1750 to 12% in 2018. Where did the rest of the CO₂ come from, then, and what is the cause of global warming (if such exists)? The authors conclude:
An article on Glacial-Interglacial Cycles (NOAA) suggests that recent increases in CO₂ and temperatures are due primarily to cyclic changes of solar radiation associated with Earth’s orbit about the sun. The annual change, DCNF(t), in the non-fossil component has positive increasing values in Table 2 (https://links.lww.com/HP/A210) after 1764. It will eventually become negative in the next glacial period when average temperatures decrease again as they have done over all of the previous glacial-interglacial cycles.
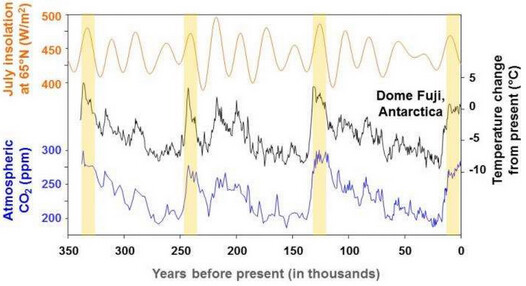
Fig. 1
Glacial-interglacial cycles. Solar radiation varies smoothly through time (top, orange line) with a strong cyclicity of ~23,000 years, as seen in this time series of July incoming solar radiation at 65°N (Berger and Loutre 1991). In contrast, glacial–interglacial cycles last ~100,000 years (middle, black line) and consist of stepwise cooling events followed by rapid warmings, as seen in this time series inferred from hydrogen isotopes in the Dome Fuji ice core from Antarctica (Kawamura et al. 2007).
They conclude:
The assumption that the increase in CO₂ since 1800 is dominated by or equal to the increase in the anthropogenic component is not settled science. Unsupported conclusions of the dominance of the anthropogenic fossil component of CO₂ and concerns of its effect on climate change and global warming have severe potential societal implications that press the need for very costly remedial actions that may be misdirected, presently unnecessary, and ineffective in curbing global warming.
