As noted in Edward Dutton and Michael Woodley’s book, At Our Wits’ End, the Flynn effect, in which intelligence, as measured by IQ test scores, was observed to have risen rapidly during the 20th century among a broadly-based population around the world, may have begun to peak and reverse starting around the mid-1990s. This phenomenon has been reported in studies done in Scandinavian countries, France, the United Kingdom, Finland, and several German-speaking countries.
In a paper to be published in the May-June 2023 issue of Intelligence, “Looking for Flynn effects in a recent online U.S. adult sample: Examining shifts within the SAPA Project”, the authors examine 13 years of data on a sample of 394,378 U.S. adults over the period 2006–2018 from the Synthetic Aperture Personality Assessment Project (SAPA Project) to test whether the Flynn effect was still in evidence. Here is the abstract.
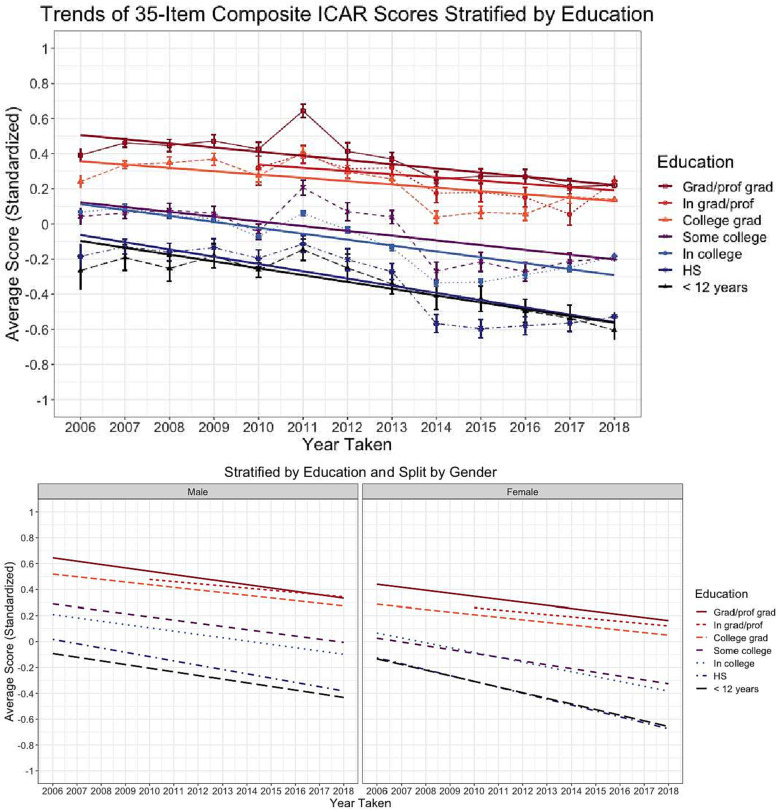
Compared to European countries, research is limited regarding if the Flynn effect, or its reversal, is a current phenomenon in the United States. Though recent research on the United States suggests that a Flynn effect could still be present, or partially present, among child and adolescent samples, few studies have explored differences of cognitive ability scores among US adults. Thirteen years of cross-sectional data from a subsample of adults (n = 394,378) were obtained from the Synthetic Aperture Personality Assessment Project (SAPA Project) to examine if cognitive ability scores changed within the United States from 2006 to 2018. Responses to an overlapping set of 35 (collected 2006–2018) and 60 (collected 2011–2018) items from the open-source multiple choice intelligence assessment International Cognitive Ability Resource (ICAR) were used to examine the trends in standardized average composite cognitive ability scores and domain scores of matrix reasoning, letter and number series, verbal reasoning, and three-dimensional rotation. Composite ability scores from 35 items and domain scores (matrix reasoning; letter and number series) showed a pattern consistent with a reversed Flynn effect from 2006 to 2018 when stratified across age, education, or gender. Slopes for verbal reasoning scores, however, failed to meet or exceed an annual threshold of |0.02| SD. A reversed Flynn effect was also present from 2011 to 2018 for composite ability scores from 60 items across age, education, and gender. Despite declining scores across age and demographics in other domains of cognitive ability, three-dimensional rotation scores showed evidence of a Flynn effect with the largest slopes occurring across age stratified regressions.
Full text of the paper is available at the article link above, or as a PDF from a button on that page. Here is a chart summarising the results:
The authors conclude:
This study set out to investigate if a Flynn effect or a reverse Flynn effect was a phenomenon in a large United States sample recruited between 2006 and 2018. Regardless of education, gender, and age, lower annual scores were observed for composite cognitive ability measured by 35 items, and the matrix reasoning and letter and number series scores measured across the 13 years of assessment. These differences were replicated across the 60-item composite ability scores from 2011 to 2018, however, three-dimensional rotation scores measured during this 8-year period showed evidence of a Flynn effect of varying magnitudes across 18- to 60-year-olds. The largest differences in mean ability scores were often observed for participants between the ages of 18 to 22. Beyond age, a reverse Flynn effect was also present across all levels of educational attainment, with the rate of decreasing scores being steeper for those with less than a 4-year college degree. While additional work needs to be done to further incorporate other demographic measures from the SAPA Project, the current study indicates that the Flynn effect and its associated reversal may no longer generalize across all ages or levels of education. It also underlines the need for further research using large adult samples to understand if the Flynn effect or if its reversal is a phenomenon in the United States during the twenty-first century.
The divergence between scores on three-dimensional shape rotation tests and all others is intriguing. I have written here earlier (2022-02-06) about the recent popular psychology distinction between “Wordcel” and “Shape Rotator” people in “ ‘Wordcel’ vs. ‘Shape Rotator’—An Introduction”. Could it be that what this research is revealing is that shape rotators, being more securely moored in the real world (many gravitate toward careers in engineering, the physical sciences, and computing), and, if graduates of higher education, more likely to have spent their time in departments less afflicted by the intellectual diseases of postmodernism, political correctness, and woke ideology, have not yet suffered the dulling of intelligence those doctrines engender? If this were the case, you would expect to see the Flynn effect still increasing scores on shape rotation tests among that cohort, while the decline in intelligence among wordcels, who already scored low on shape rotation tasks, would have little effect on the overall score.