Here are the rest of the IQ-related articles from the archive of the defunct Mega Society website: Intelligence Site Map.
Below is my research on how to convert between “ratio IQ” (mental age / chronological age) and “deviation IQ” (IQ as measured by standard tests at a given age).
The spreadsheet functions should be quite useful for school psychologists and parents of gifted kids advocating for grade-skips and more radical acceleration. These functions allow finding the percentile that a child would be when placed in a class of a different age, and finding how that will change over the course of a school term.
The most interesting theoretical finding, I think, is that the ratio of development rates for children of different ages is simply the ratio of the squares of their ages - e.g. a seven year old increases in intelligence twice as fast as a 10 year old.
Summary
Please check for errors before relying on these functions
“W score” is a measure of intelligence used in the Woodcock-Johnson IQ tests, specifically the W-score for “General Intellectual Ability” in the WJ-IV test. (Each of the many subtests and scales in the WJ has it’s own W-score). The Stanford-Binet IQ tests, also published by Riverside Publishing, use “CSS” scores, which are essentially equivalent to WJ W-scores. The W and CSS scores are defined so that an average 10 year old scores 500 (in their American norming samples).
W and CSS scores are “ratio scales” in that all arithmetic operations including division are meaningful, that is, one can say that one person’s score is some percentage higher or lower than another person’s score, which is not valid for IQs. In this regard, W and CSS scores are like temperatures measured in Kelvin, while IQ and other test scores are like temperatures measured in degrees Celsius or degrees Fahrenheit.
W and CSS scores are also comparable across people of different ages, including between children and adults, which is not true for IQ scores. W and CSS scores provide a direct measure of ability and of the difficulty of problems which a person can answer correctly, unlike other measures such as IQ scores, percentiles and most other test scores.
The following equations were derived from empirically fitting curves to the data in Appendix C of:
McGrew, K. S., LaForte, E. M., & Schrank, F. A. (2014). Technical Manual. “Woodcock-
Johnson IV.” Rolling Meadows, IL: Riverside. (Table C-1, pp. 279-280)
mean_W[age] = 547 - 473 / age
This gives the average W-score (= 100 IQ) for a given age between 5 and 17.
SD_W[age] = 23/321 * age^2 - 167/87 * age + 89/4 // rational approximation
This gives the standard deviation size in W-score points for a given age between 5 and 17.
[mean_W and SD_W valid for age [5, 17]; the actual standard deviations differ by an average of -0.28 points, but in two cases (ages 9 and 11) the measured s.d. is over 1 point less than the rational approximation curve fit. This may be an artifact of the particular norming sample; the data is noisy, the s.d.s vary from one age to the next year by up to 2 points, and vary from the curve fit by nearly that much year-to-year. The curve fit was selected assuming that low s.d. numbers compared to neighboring years were likely to be in error. For the actual s.d. numbers refer to the WJ-IV Technical Manual pp. 279-80.]
W_adult_average = 520
W_adult_SD = 10.5
[It is within the margin of error of the data to use 520, s.d. 10.5 for ages above 17. The data for ages 18 and 19 are noisy: 515.8, s.d 10.73 age 18 (2.3 points lower than the expected 518.1); and 519 s.d. 11.2 age 19. More accurate figures for higher ages: 521, s.d. 10 in the 20s; 520, s.d. 11 in the 30s; 517.5, s.d 12 in the 40s; 516.5 s.d. 12 in the 50s]
W[IQ_adult] = (IQ_adult - 100) / 15 * 10.5 + 520
W[IQ_adult] = 0.7 * IQ_adult + 450
This gives the W-score equivalent to an adult IQ score.
[IQ mean 100, s.d. 15; IQ_adult preferably age [20, 40], but not too far off for ages [18, 70]]
mental_age[W] = 473 / (547 - W)
[valid for W between [451, 517], This gives the mental age equivalent of a W-score, that is, the age for which that W-score is the average score.]
mental_age[IQ_adult] = 473 / (97 - ( 0.7 * IQ_adult))
[for adult IQ between about 40 to 97]
This gives the mental age equivalent of an adult IQ score, that is, the age for which that adult IQ’s raw test score would be the average score.
Z_score[IQ] = (IQ - 100)/15
Z_score[percentile] = NORMSINV(percentile) // OpenOffice or Excel function
[“percentile” must be a fraction between 0 and 1 (to be technical, to keep Z_score in the range [-4,4]: [(1/31574), (1 - 1/31574)] ); divide conventional percentile by 100 if needed to make it between 0 and 1]
This gives the Z-score equivalent of a percentile ranking. Z-score is the number of standard deviations a score is above or below average for that age.
Z_score[W, age] = (W - mean_W[age]) / SD_W[age]
= Z_score[W, age] = (W - (547 - 473 / age))/(23/321 * age^2 - 167/87 * age + 89/4)
[Valid for ages [5, 17].]
This gives the Z-score equivalent of a W score at a given age. Z-score is the number of standard deviations a score is above or below average
percentile[Z_score] = NORMDIST(Z_score,0,1)
[“percentile” will be a fraction between 0 and 1; multiply by 100 to get a conventional percentile]
This gives the percentile equivalent to a given Z-score, that is, equivalent to that number of standard deviations above or below the average, depending on the sign of the score.
W[percentile, age] = Z_score[percentile] * SD[age] + mean_W[age]
= W[percentile, age] = ( NORMSINV(percentile) * (23/321 * age^2 - 167/87 * age + 89/4) + (547 - 473/age) )
[Valid for ages [5, 17].]
This gives the percentile equivalent to a given Z-score, that is, equivalent to that number of standard deviations above or below the average, depending on the sign of the score.
W[IQ, age] = Z_score[IQ] * SD_W[age] + mean_W[age]
= W[IQ, age] = ((IQ - 100)/15) * (23/321 * age^2 - 167/87 * age + 89/4) + (547 - 473 / age)
[For ages above 17 use: W[IQ_adult] = 0.7 * IQ_adult + 450.]
This gives the W-score equivalent to an IQ and age.
IQ_adult[W] = (W - 450)/0.7
This gives the adult IQ equivalent to a W-score.
IQ_adult[IQ, age] = IQ_adult[W[IQ, age]] = (W[IQ, age] - 450)/0.7
= IQ_adult[IQ, age] = ((((IQ - 100)/15) * (23/321 * age^2 - 167/87 * age + 89/4) + (547 - 473 / age)) - 450)/0.7
[Valid for ages [5, 17].]
This gives the adult IQ equivalent for a child’s IQ score and age
IQ_adult[percentile, age] = IQ_adult[ W[percentile, age] ] = (W[percentile, age] - 450)/0.7
= IQ_adult[percentile, age] = ((NORMSINV(percentile) * (23/321 * age^2 - 167/87 * age + 89/4) + (547 - 473/age)) - 450)/0.7
This gives the adult IQ equivalent for a child’s percentile score and age
percentile_in_placement_class[child_percentile, child_age, class_age]
=> W[child_percentile, child_age] → Z_score[W, class_age] → percentile[Z_score] → percentile_in_placement_class
= percentile[ Z_score[ W[ child_percentile, child_age ], class_age ] ]
This gives a child’s percentile ranking relative to a class of a different age.
percentile_in_placement_class[child_percentile, child_age, class_age] = NORMDIST((( ( NORMSINV(child_percentile) * (23/321 * child_age^2 - 167/87 * child_age + 89/4) + (547 -473/child_age) ) - (547 - 473 / class_age))/(23/321 * class_age^2 - 167/87 * class_age + 89/4)),0,1)
[for both child_age, class_age in ages [5,17]; child_percentile should preferably be percentile for the child’s age at the time they took the test, but if the test percentiles are defined for a different age, as when the child has already been grade-skipped or held back and is taking tests which presume a standard age different from the child’s true age, then the age for which the test is intended should be used as child_age in this function.]
percentile_in_placement_class[child_percentile, child_age] = percentile_adult[child_percentile, child_age]
[For child_age [5,17] and class_age greater than 17.]
percentile_adult[child_percentile, child_age] = NORMDIST(((( NORMSINV(child_percentile) * (23/321 * child_age^2 - 167/87 * child_age + 89/4) + (547 - 473/child_age) ) - 520)/10.5),0,1)
[One needs to differentiate between 1.) the age at which the test was taken (or standard age assumed for the test.) 2.) the age which the child will be when starting the new placement in the new class. & the class_age at the start of the class 3.) the age the child will be at the completion of the class / class_age at completion of the class.]
[Due to the faster rate of increase of ability at younger ages than older ages, when using percentile_in_placement_class function the calculation should be done at least twice: for the ages at the start and end of the school year or term.]
predicted_W[W_age_1, age_1, age_2] = Z_score[W_age_1, age_1] * SD_W[age_2] + mean_W[age_2]
= predicted_W[W_age_1, age_1, age_2] = ((W - (547 - 473 / age_1))/(23/321 * age_1^2 - 167/87 * age_1 + 89/4))*(23/321 * age_2^2 - 167/87 * age_2 + 89/4) + (547 - 473 / age_2)
[Both age_1, age_2 ages [5,17].]
This gives the predicted W-score at age_2, given a W-score at age_1. Age_2 can be older or younger than age_1.
development_ratio_mean[age_1, age_2] = age_2^2 / age_1^2
[This gives the relative rates of increase of W scores at two ages between [5,17]. This can be thought of as: years of development at age_1 per year of development at age_2. For instance, a child age 7 will increase in ability about twice as fast as one aged 10.]
The development ratio, assuming age_1 is less than age_2, gives a number greater than 1, which is the factor by which average W-scores increase more quickly at age_1 than at age_2.
| age |
5 |
6 |
7 |
8 |
9 |
10 |
11 |
12 |
13 |
14 |
15 |
16 |
17 |
18 |
| General Intellectual Ability |
450.99 |
467.16 |
479.22 |
487.67 |
495.04 |
499.9 |
504.55 |
507.5 |
509.8 |
512.9 |
514.31 |
516.47 |
517.13 |
515.79 |
| smoothed sd |
14.6 |
13.2 |
12.35 |
11.35 |
10.7 |
10.2 |
9.75 |
9.6 |
9.5 |
9.5 |
9.6 |
9.9 |
10.2 |
10.7 |
| sd |
14.57 |
12.57 |
12.35 |
11.09 |
9.23 |
10.43 |
8.79 |
8.91 |
9.6 |
9.87 |
9.34 |
10.49 |
9.66 |
10.73 |
| sd ratio |
1.00 |
1.05 |
1.00 |
1.02 |
1.16 |
0.98 |
1.11 |
1.08 |
0.99 |
0.96 |
1.03 |
0.94 |
1.06 |
1.00 |
| error |
2.52 |
2.18 |
2.14 |
1.92 |
1.85 |
2.09 |
1.97 |
1.99 |
1.94 |
1.97 |
1.87 |
2.1 |
1.67 |
1.86 |
| 55 IQ (1 in 741) |
407.19 |
427.56 |
442.17 |
453.62 |
462.94 |
469.3 |
475.3 |
478.7 |
481.3 |
484.4 |
485.51 |
486.77 |
486.53 |
483.69 |
| 70 IQ (1 in 44) |
421.79 |
440.76 |
454.52 |
464.97 |
473.64 |
479.50 |
485.05 |
488.30 |
490.80 |
493.90 |
495.11 |
496.67 |
496.73 |
494.39 |
| 85 IQ (1 in 6.3) |
436.39 |
453.96 |
466.87 |
476.32 |
484.34 |
489.7 |
494.8 |
497.9 |
500.3 |
503.4 |
504.71 |
506.57 |
506.93 |
505.09 |
| 100 IQ (1 in 2, avg.) |
450.99 |
467.16 |
479.22 |
487.67 |
495.04 |
499.9 |
504.55 |
507.5 |
509.8 |
512.9 |
514.31 |
516.47 |
517.13 |
515.79 |
| 115 IQ (1 in 6.3) |
465.59 |
480.36 |
491.57 |
499.02 |
505.74 |
510.1 |
514.3 |
517.1 |
519.3 |
522.4 |
523.91 |
526.37 |
527.33 |
526.49 |
| 130 IQ (1 in 44) |
480.19 |
493.56 |
503.92 |
510.37 |
516.44 |
520.3 |
524.05 |
526.7 |
528.8 |
531.9 |
533.51 |
536.27 |
537.53 |
537.19 |
| 145 IQ (1 in 741) |
494.79 |
506.76 |
516.27 |
521.72 |
527.14 |
530.5 |
533.8 |
536.3 |
538.3 |
541.4 |
543.11 |
546.17 |
547.73 |
547.89 |
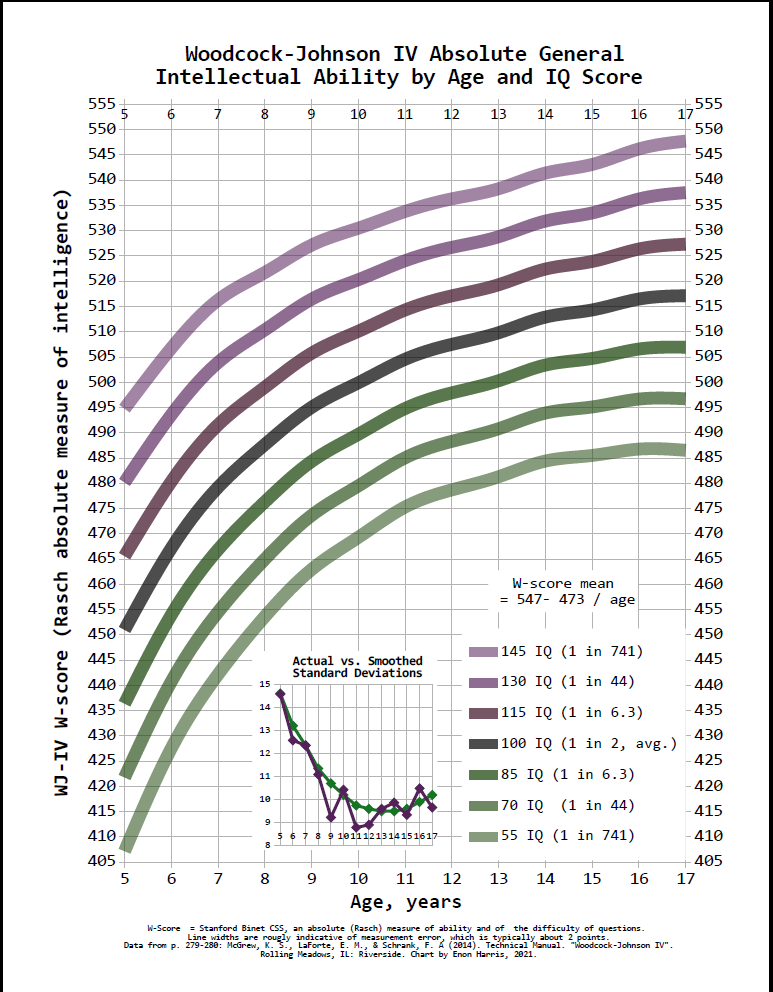
That was the data for the following graphs:
[Edit: better version of graph.]
From an email to the Davidson Institute (to which they didn’t reply):
Few users really get the significance of the graph on first sight, it takes some playing around, reading off the equivalences between different ages with the same score, before most find it interesting.
Example equivalences:
    Age 18, IQ 70 is the standard to be a legally competent adult, which is a W-score of 500. Most 10 year-olds score that high or higher. Those with 85 IQ score that high by age 13; 115 IQ by age 8; 130 IQ by age 6.5.

    Elementary school teachers usually score in the low 520s, bright kids will be smarter by age 8 to 11.

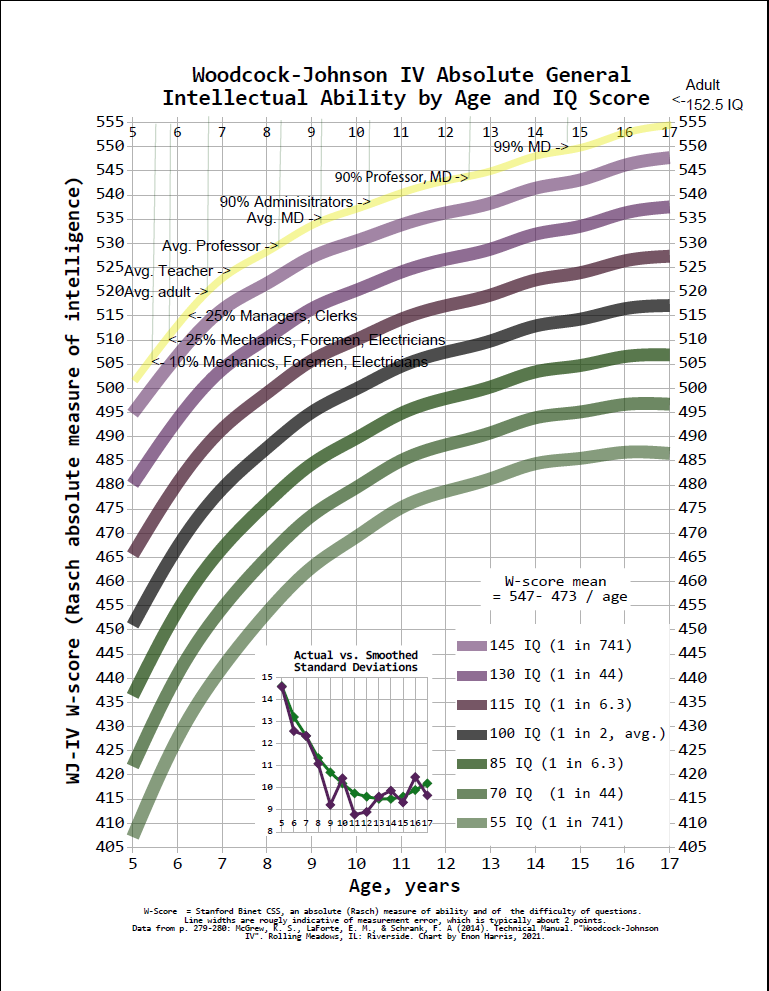
    Students in top universities score around 535, a child not yet 10 with an IQ in the 150s will score that high - but will likely be stuck in the 4th grade with a teacher about as smart as the child was at 7.
I have also included a version of the graph with intelligence levels of various professions. The accuracy of these estimates for professions is not as certain as I’d prefer, but it is the best data I have been able to find. The original source was: Figure 12 of Hauser, Robert M. 2002. “Meritocracy, cognitive ability, and the sources of occupational success.” CDE Working Paper 98-07 (rev). Center for Demography and Ecology, The University of Wisconsin-Madison, Madison, Wisconsin. The figure is labelled "Wisconsin Men’s Henmon-Nelson IQ Distributions for 1992-94 Occupation Groups with 30 Cases or More (indirectly via iqcomparisonsite.com).


