The effects of large-scale immigration on developed societies has been a matter of heated debate for more than a century. Advocates of immigration cite the benefits of “new blood”, cultural diversity, mitigating the impact of a low birth rate and aging among the native population on social services funded by employment taxes, and claims of a better work ethic and entrepreneurial inclination among immigrant groups. Opponents argue immigration drives down wages in the employment market, especially for minorities and youth seeking entry, increases ethnic polarisation and strife, strips immigrants’ countries of origin of their intellectual élites, and imports a population with demonstrated high rates of crime in both their native countries and after arrival.
Both sides of this debate summon statistics to buttress their arguments, but in many cases the statistics are fuzzy and make it difficult to isolate individual effects. This is especially compounded in countries with a large rate of illegal immigration, which by its nature escapes statistical tracking.
“Inquisitive Bird”, writing on the Patterns in Humanity Substack site, notes that Scandinavian countries do an excellent job in tracking their population and its composition and behaviour, maintaining formal population registers which are accessible to researchers. In the 2023-02-17 post, “The Effects of Immigration in Denmark”, the Bird analyses Danish government reports, including “Immigrants’ net contribution to the public finances in 2018”, to tease out the actual effects of immigration and the immigrant population on Denmark.
Here is the average net financial contribution by age for 2018 for four components of the population.
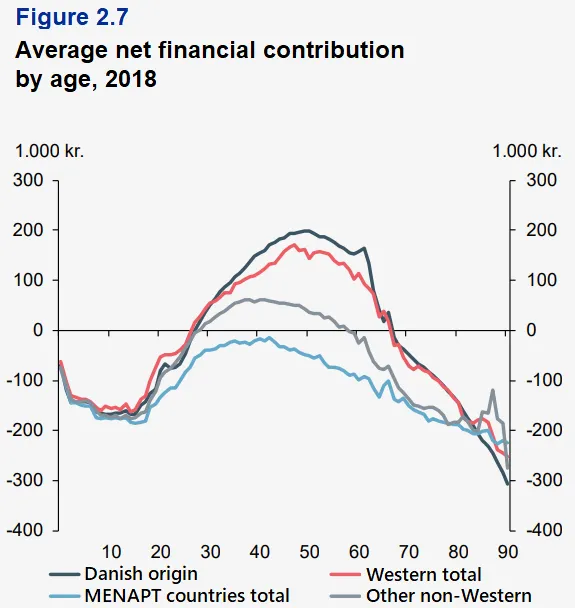
For all groups, maximum net contribution occurs in the prime working years, with net expense during childhood and old age. But the magnitude varies dramatically with population group. Immigrants from Western countries perform only slightly below Danes, but those from MENAPT (Middle East, North Africa, Pakistan and Turkey) counties never become net contributors, even in their peak earning years.
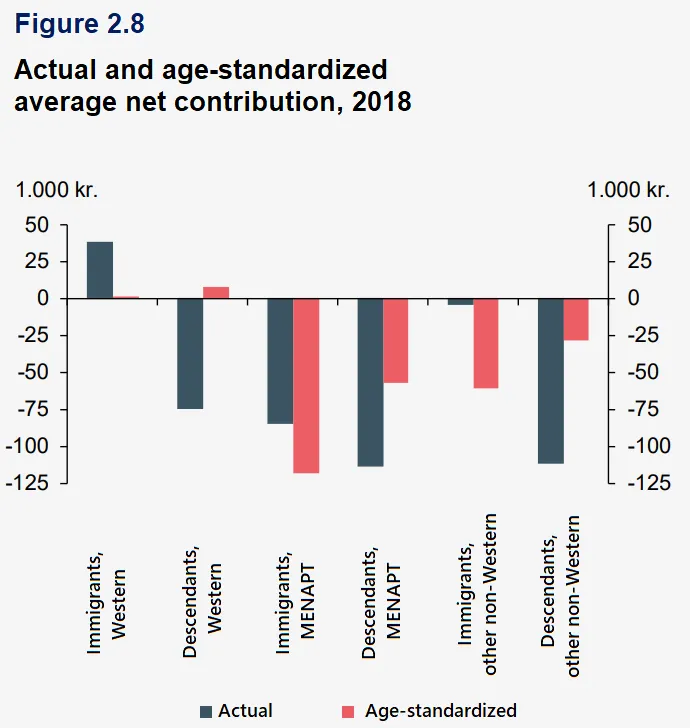
But these figures do not take into account the age distribution among the different population segments, which varies substantially. Inquisitive Bird then age-adjusted the net contributions of both first-generation immigrants and their descendants for the various groups and found:
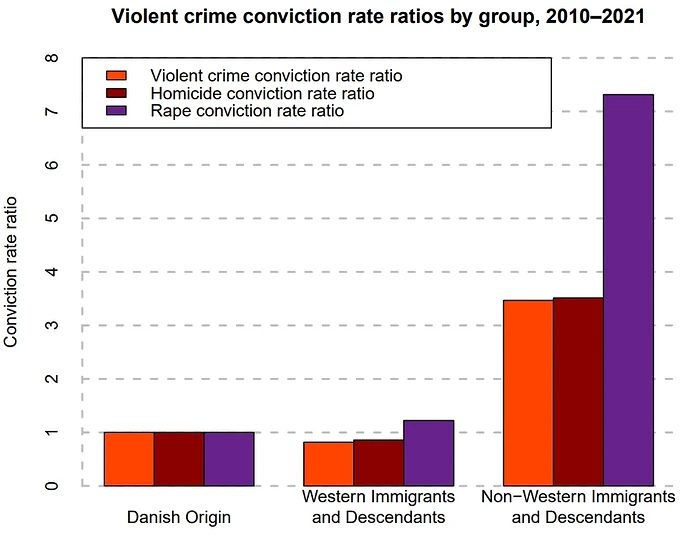
How about the connection between immigration and crime? Here, we need to scale the number of crimes committed by the proportion that a given group makes up of the overall population. In 2021, 71% of violent crimes were committed by those of Danish origin and 29% by immigrants and descendants, but immigrants and descendants made up only 14% of the population that year, so the rate of violent crime committed by immigrants was 2.5 times higher. Now, let’s break that down by Danes, Western Immigrants, and Non-Western immigrants, plotting rates of conviction, with native Danes normalised to 1.
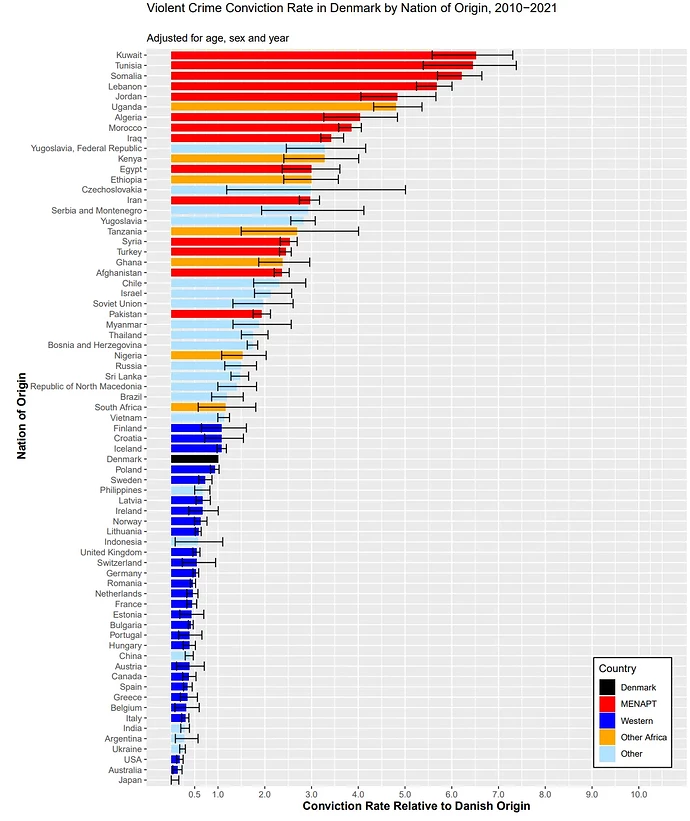
As is well known, violent crimes are disproportionally committed by young males, so adjusting for the sex and age of those convicted, and zooming in on individual countries, allows comparison by the country of origin of immigrant population.
Violent crime conviction rates for immigrants in 2010–2021 by nation of origin expressed in multiples of the Danish conviction rate. Adjusted for differences in age and sex composition. Error bars are bootstrapped 95% confidence intervals.
Read the whole thing. Don’t you wish your country collected and published comparable statistics about its immigrant population, or that this kind of information informed immigration policy?
