The Network of Global Corporate Control
Stefania Vitali, James B. Glattfelder, and Stefano Battiston
[Chairs of Systems Design, ETH Zurich, Zurich, Switzerland]
PLoS One. 2011; 6(10)
Abstract
The structure of the control network of transnational corporations affects global market competition and financial stability. So far, only small national samples were studied and there was no appropriate methodology to assess control globally. We present the first investigation of the architecture of the international ownership network, along with the computation of the control held by each global player. We find that transnational corporations form a giant bow-tie structure and that a large portion of control flows to a small tightly-knit core of financial institutions. This core can be seen as an economic “super-entity” that raises new important issues both for researchers and policy makers.
Methods
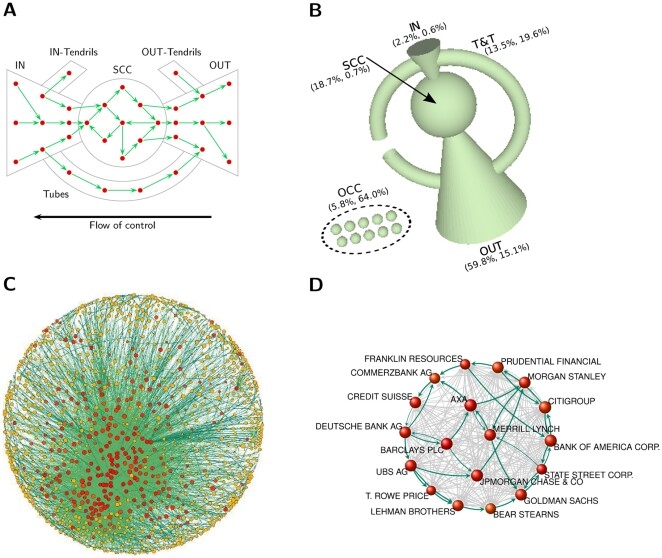
[…fun with matrices and graphs…]
Because of indirect links, control flows upstream from many firms and can result in some shareholders becoming very powerful. However, especially in graphs with many cycles (see Figures 1B and S4 in Appendix S1), the computation of c^net, in the basic formulation detailed above, severely overestimates the control assigned to actors in two cases: firms that are part of cycles (or cross-shareholding structures), and shareholders that are upstream of these structures. […] In this paper […] we develop a new methodology to overcome the problem of control overestimation, which can be employed to compute control in large networks.[The transnational corporate network’s] peculiarity is that the strongly connected component, or core, is very small compared to the other sections of the bow-tie […] about 3/4 of the ownership of firms in the core remains in the hands of firms of the core itself. In other words, this is a tightly-knit group of corporations that cumulatively hold the majority share of each other.
The authors buried the lede as deeply as they could, relegating the list of the most powerful companies to p. 17 of the supplementary material, then formatting it as a cumulative share rather than giving each company’s share. I recalculated and formatted the list to show each company’s share. Note that the underlying data is from 2007.
| Rank | Name | Country | Cumulative network control (%) | Network control (%) |
|---|---|---|---|---|
| 1 | BARCLAYS PLC | GB | 4.05% | 4.05% |
| 2 | CAPITAL GROUP COMPANIES INC, THE | US | 6.66% | 2.61% |
| 3 | FMR CORP | US | 8.94% | 2.28% |
| 4 | AXA | FR | 11.21% | 2.27% |
| 5 | STATE STREET CORPORATION | US | 13.02% | 1.81% |
| 6 | JPMORGAN CHASE & CO. | US | 14.55% | 1.53% |
| 7 | LEGAL & GENERAL GROUP PLC | GB | 16.02% | 1.47% |
| 8 | VANGUARD GROUP, INC., THE | US | 17.25% | 1.23% |
| 9 | UBS AG | CH | 18.46% | 1.21% |
| 10 | MERRILL LYNCH & CO., INC. | US | 19.45% | 0.99% |
| 11 | WELLINGTON MANAGEMENT CO. L.L.P. | US | 20.33% | 0.88% |
| 12 | DEUTSCHE BANK AG | DE | 21.17% | 0.84% |
| 13 | FRANKLIN RESOURCES, INC. | US | 21.99% | 0.82% |
| 14 | CREDIT SUISSE GROUP | CH | 22.81% | 0.82% |
| 15 | WALTON ENTERPRISES LLC | US | 23.56% | 0.75% |
| 16 | BANK OF NEW YORK MELLON CORP. | US | 24.28% | 0.72% |
| 17 | NATIXIS | FR | 24.98% | 0.70% |
| 18 | GOLDMAN SACHS GROUP, INC., THE | US | 25.64% | 0.66% |
| 19 | T. ROWE PRICE GROUP, INC. | US | 26.29% | 0.65% |
| 20 | LEGG MASON, INC. | US | 26.92% | 0.63% |
| 21 | MORGAN STANLEY | US | 27.56% | 0.64% |
| 22 | MITSUBISHI UFJ FINANCIAL GROUP, INC. | JP | 28.16% | 0.60% |
| 23 | NORTHERN TRUST CORPORATION | US | 28.72% | 0.56% |
| 24 | SOCIETE GENERALE | FR | 29.26% | 0.54% |
| 25 | BANK OF AMERICA CORPORATION | US | 29.79% | 0.53% |
| 26 | LLOYDS TSB GROUP PLC | GB | 30.30% | 0.51% |
| 27 | INVESCO PLC | GB | 30.82% | 0.52% |
| 28 | ALLIANZ SE | DE | 31.32% | 0.50% |
| 29 | TIAA | US | 32.24% | 0.92% |
| 30 | OLD MUTUAL PUBLIC LIMITED COMPANY | GB | 32.69% | 0.45% |
| 31 | AVIVA PLC | GB | 33.14% | 0.45% |
| 32 | SCHRODERS PLC | GB | 33.57% | 0.43% |
| 33 | DODGE & COX | US | 34.00% | 0.43% |
| 34 | LEHMAN BROTHERS HOLDINGS, INC. | US | 34.43% | 0.43% |
| 35 | SUN LIFE FINANCIAL, INC. | CA | 34.82% | 0.39% |
| 36 | STANDARD LIFE PLC | GB | 35.20% | 0.38% |
| 37 | CNCE | FR | 35.57% | 0.37% |
| 38 | NOMURA HOLDINGS, INC. | JP | 35.92% | 0.35% |
| 39 | THE DEPOSITORY TRUST COMPANY | US | 36.28% | 0.36% |
| 40 | MASSACHUSETTS MUTUAL LIFE INSURANCE | US | 36.63% | 0.35% |
| 41 | ING GROEP N.V. | NL | 36.96% | 0.33% |
| 42 | BRANDES INVESTMENT PARTNERS, L.P. | US | 37.29% | 0.33% |
| 43 | UNICREDITO ITALIANO SPA | IT | 37.61% | 0.32% |
| 44 | DEPOSIT INSURANCE CORPORATION OF JP | JP | 37.93% | 0.32% |
| 45 | VERENIGING AEGON | NL | 38.25% | 0.32% |
| 46 | BNP PARIBAS | FR | 38.56% | 0.31% |
| 47 | AFFILIATED MANAGERS GROUP, INC. | US | 38.88% | 0.32% |
| 48 | RESONA HOLDINGS, INC. | JP | 39.18% | 0.30% |
| 49 | CAPITAL GROUP INTERNATIONAL, INC. | US | 39.48% | 0.30% |
| 50 | CHINA PETROCHEMICAL GROUP CO. | CN | 39.78% | 0.30% |
As of 2007, the Quaker-origin banks, Barclays and Lloyds, had
4.56% control of the worlds publicly traded corporations, vs.
4.35% for J.P. Morgan-Chase, Merrill Lynch, Goldman Sachs, Morgan Stanley, and Bank of America combined.
France had 4.19%, the rest of Britain had 3.7%.
This despite there likely being fewer than half a million silent-meeting Quakers in the US and Britain in history, peaking at 80,000 in the late 1600s, with about 50,000 or so today, of whom only a very small fraction have long Quaker ancestry.