Tom Bartelson of Pepperell, Massachusetts, who was at the country club, described a chaotic scene that unfolded near his nephew’s wedding. He said he heard the shooter say “the children are safe” and “free Palestine” and appeared to be targeting someone.
NEW: The man who shot up the ABC affiliate in Sacramento following the suspension of Jimmy Kimmel, has been identified as Anibal Hernandez-Santana.
— Collin Rugg (@CollinRugg) September 20, 2025
An X account that appears to belong to Hernandez-Santana is full of anti-Trump posts, as reported by Variety.
The man, 64,… pic.twitter.com/4fZmyLZCkR
Not Mollie Hemingway, but:
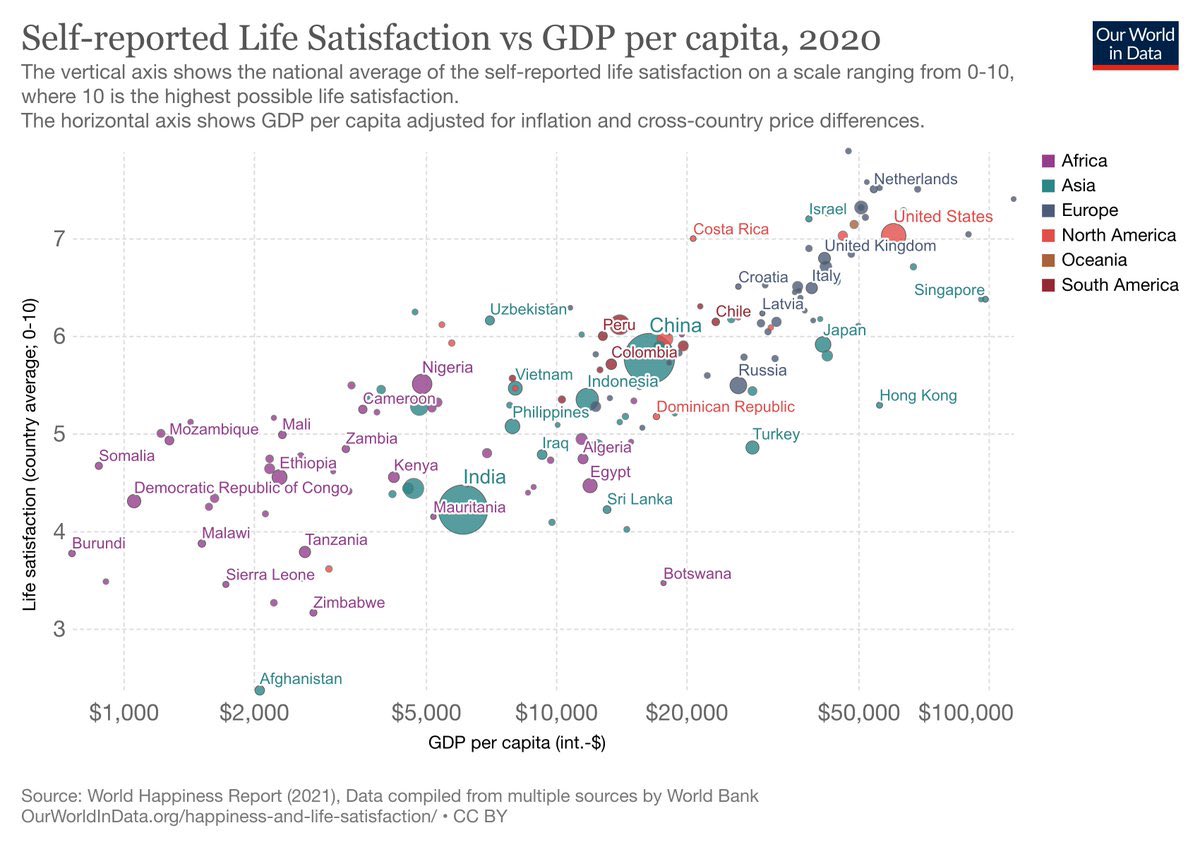
It is surprising to see “Self-reported life satisfaction” well below trend in Botswana and Hong Kong – both places which are highly regarded in other respects. Perhaps the self-reporting aspect is heavily influenced by local culture?
https://www.courtlistener.com/docket/71418510/united-states-v-santana/
During the search, detectives located a handwritten note that read, “For hiding Epstein & ignoring red flags. Do not support Patel, Bongino, & AG Pam Bondie. They’re next. – C.K. from above.” The FBI conducted a probable cause arrest on HERNANDEZ SANTANA later that evening.
Regarding Hong Kong, I note these data represent 2020-21. Perhaps the lower than expected life satisfaction reflects turmoil in the aftermath of the Chinese anti-democracy crackdown that was going on before the emergence of COVID.
As for Botswana, I note that the population (2.3M) is small and may be inadequately sampled and the difference between adjusted GDP (used in chart) and nominal GDP is large (according to Wikipedia, nominal per-capita GDP is less than $8K). And maybe this claim, from Wikipedia, is relevant: ‘Botswana lost its status as a “liberal democracy” in 2021, with its liberal, participatory and deliberative components decreasing “at a statistically significant level”, with the latter component being noted as becoming “significantly worse”‘.
So explain to me of what importance this chart is.
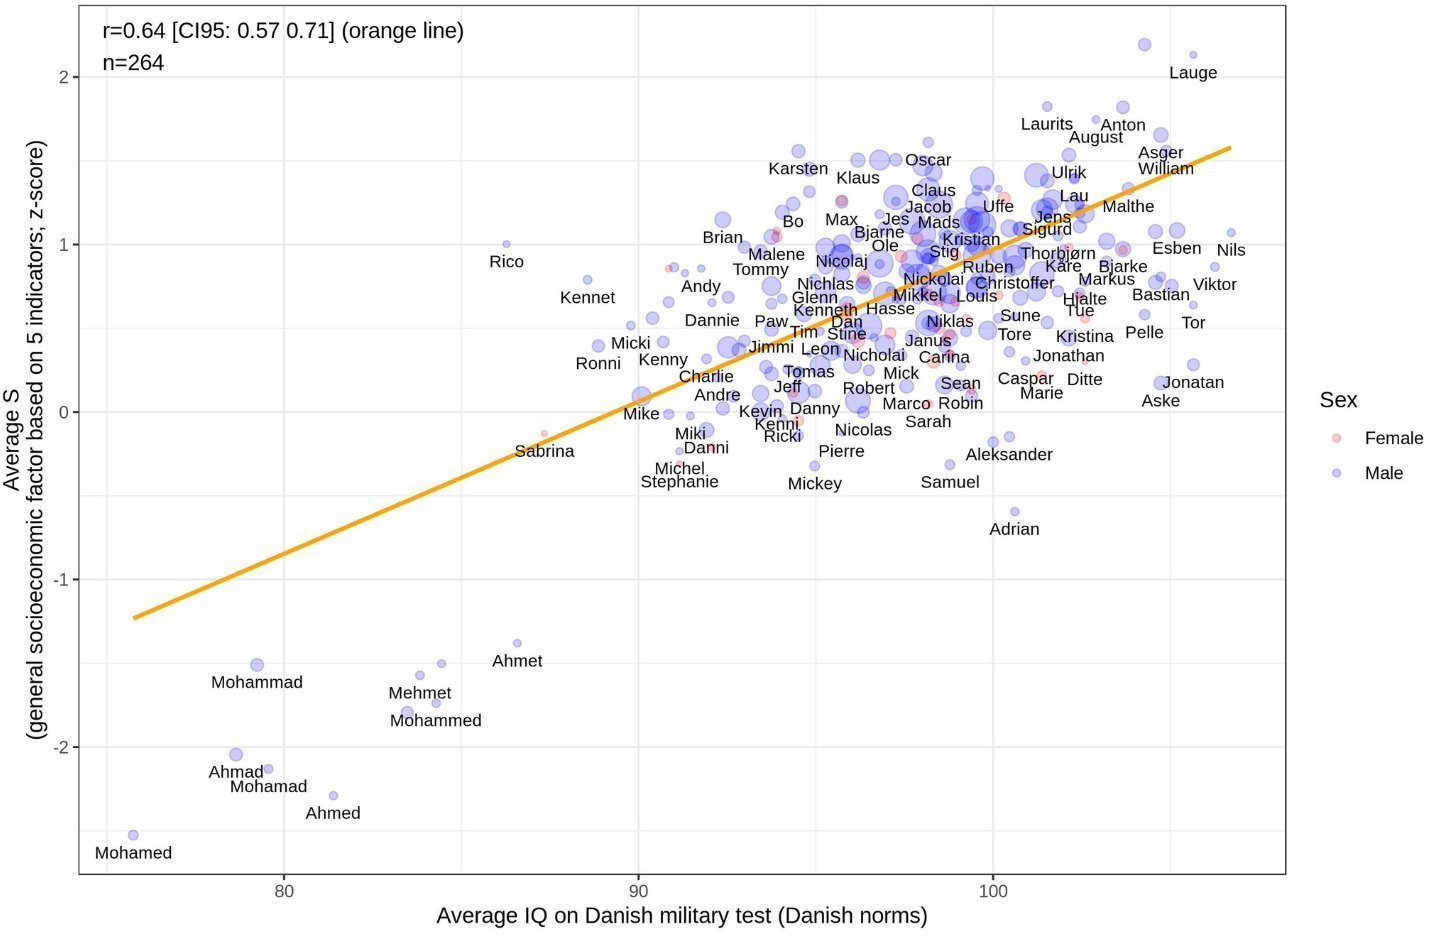
How to name your kids so that they might be perceived as intelligent and/or wealthy if you’re Danish? ![]()
This seems to be a decent example of linear regression chasing outliers, in this case representing the clearly separate population consisting of Islamic names. With those removed, I’d bet the slope is zero. That being said, I’m going to advocate for the next grandson to be named Lauge. ![]()
Nope, clearly not. This is not only visually evident; it is also clear from the much larger number of data (more than 10X) in the upper group that the regression is dominated by those points.
I’m away from my computer now, else I’d do a regression on the upper group. My guess is that the slope would change slightly.
Addendum: The original paper by Emil Kirkegaard is linked in the X post. He weighted each data point by sqrt(n), which makes the case even stronger since many of the upper points are larger.
Furthermore, the author is well aware of these outlier points and notes that,
It is obvious from the plot that the nonwestern names fall substantially below the regression line, indicating an omitted variable.
He did a fit omitting the Muslim names and found, as expected, a somewhat decreased value of r. As is also evident from a visual inspection of the plot, the slope is steeper for the nonwestern names:
Similarly, a simple regression showed that taking IQ into account, thenonwestern names had a beta of -1.73, i.e. they fared much worse than their measured intelligence level would predict.
Kirkegaard is a careful researcher who understands statistical methods well. Anyone who’d like to dig deeper can find the data in the R notebook that he posted.
Thanks for the link. I’ll take a look at those data when I get a chance.
OK. I’m slow, but it seems to me that only a small number of low scores can trash a name, especially if there aren’t a lot of names in the group. The fewer the number, the more the effect. But there is also an effect in the amount of decrease in every name group. So small decreases make little change but larger ones are more important.
But my question remains - ?of what import is this. Clearly any given name is only a predictor of a group result, not the individual name. IQ is a more random characteristic than “naming” unless the group that uses that name is inherently stupid. Yet even in that group a genius can spring up - as well as a dolt (and inbreeding will cause more dolts than a general population).
?Do I have that right.
I did a quick look at those data, merging the two datasets provided and extracting variables “IQ_raw” and “S.both.no.age”. Merging ignored sex. I did not do any weighting by commonality of the names. The resulting dataset has 265 points (published plot has 264) but appears at least superficially similar to the version posted earlier. The published plot’s abscissa appears to be a rescaled version of “IQ_raw”.
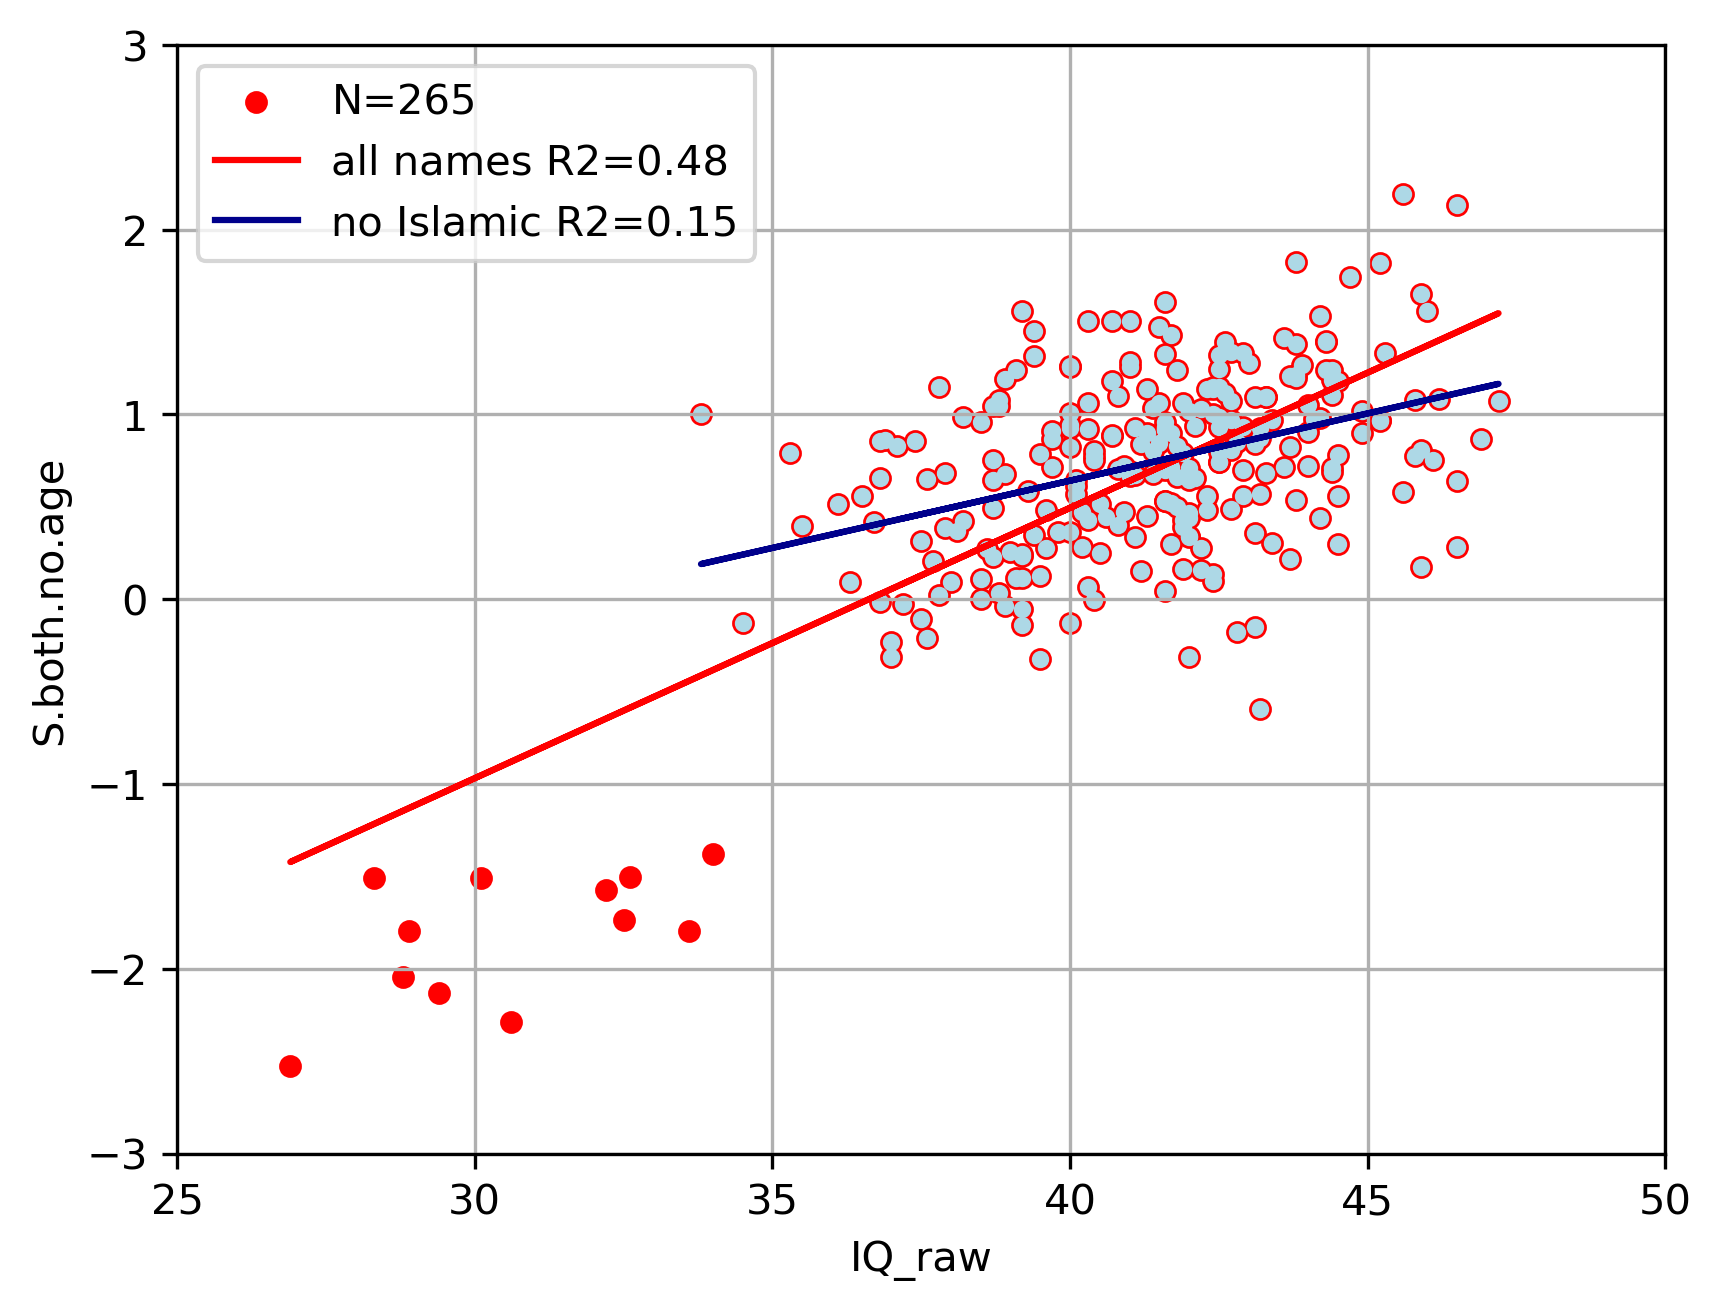
The full dataset, which includes the Islamic names and is represented by the red+blue dots, has an R2 = 0.48, which is r = 0.69, a little higher than what is reported on the published plot. That regression line is in red.
The 12 Islamic names are plotted in red are excluded from the fit applied only to the blue points, indicated by the blue line. That R2 = 0.15 (r = 0.39). Nothing for me to get excited about. Maybe this changes with giving greater weight to the more popular names, but my sense is it will actually make it worse. The total sum of the names is 64690 and there are only 433 Islamic samples. Weighting those less would minimize their leverage on the full regression line, which is rather substantial in the full dataset.
The good news for the Dutch military is there are not a lot of low IQ persons with Islamic names to deal with, but I suppose it only takes a few.
As I explained previously, the names were weighted by sqrt(n), which means a name that appears 1000 times is weighted 10X more than a name that appears 10 time because sqrt(1000/10)=10. The more often it appears, the more heavily weighted. The size of the points is proportional to the frequency of each name.
Yeah, that is exactly the point. IQ is not random; it is correlated with being nonwestern versus western. Take a look at a world map of IQ by country and all will become clear.
Your fit appears to not weight the frequency of names but the author explicitly said he weighted the names by sqrt(n), as mentioned in my original comment. Presumably, that is why your regression line is steeper than the published one. Once the names are weighted as the author did, the nonwestern names become less important in the fit and their inclusion has a smaller effect on the slope. Thus, the two slopes would be closer to each other than in your graph.
This quibbling over the effect of inclusion or exclusion of the nonwestern names misses the key points of the paper altogether, some of which I quoted in my original comment. Neither of these two points have anything to do whatsoever with the slope of the regression line, with or without nonwestern names.
It never ceases to amaze me that anyone still believes that IQ is independent of race/ethnicity on the average — that IQ is, somehow, a random characteristic. The Blank Slate has been a remarkably successful and resilient bit of propaganda.
My interest in the graph posted by @eggspurt [thanks, E.] stems from the fact that the regression line shown implies the presence of a single population with moderately large within-group variance when a better explanation is that there are two distinct populations each with more modest within-group variance. Many such cases, and in some the distinction between the two interpretations is important.
I also realized that the authors of the graph made available figures showing what the regressions look like with and without weighting, which support my surmise based on leverage.