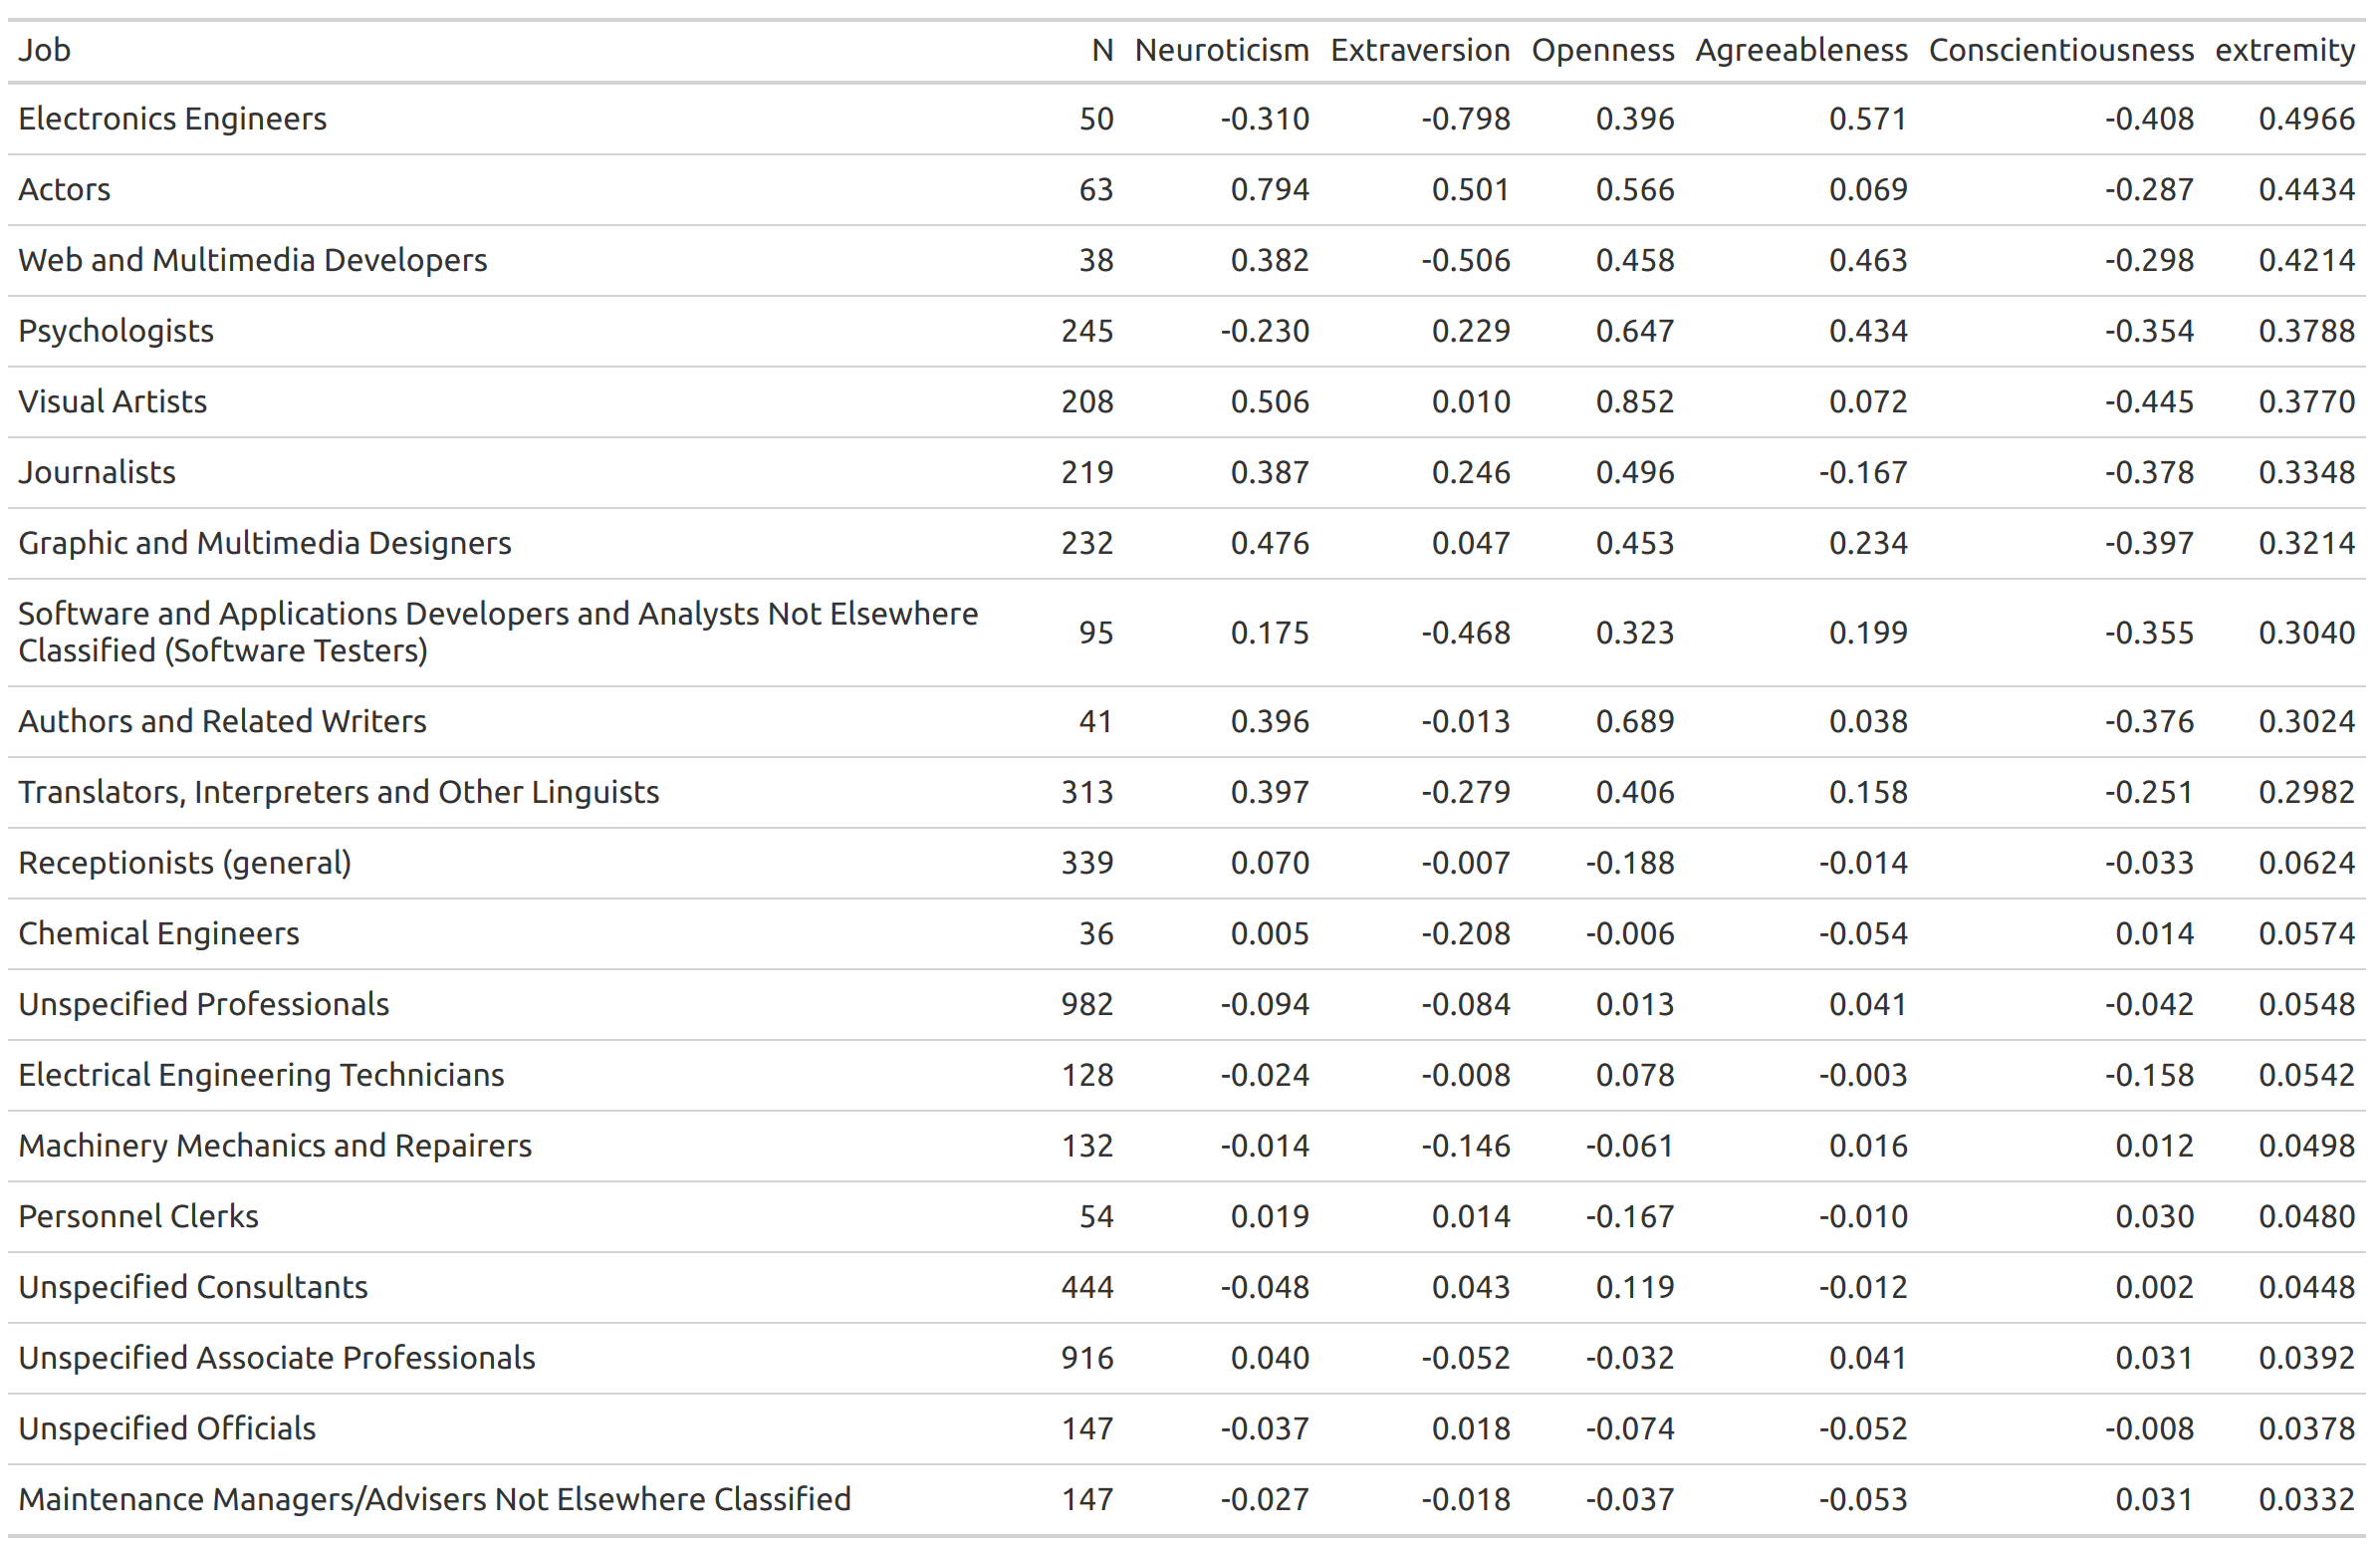
Interesting to see Electronics Engineers lead the charge as least extroverted, highly agreeable (!) and low conscientiousness. For roughly the same number of samples, Actors are more plausibly captured in this study for this reader.
3 Likes
On your previous graph I noticed the Electronics Engineers. Since that is my degree, I was wondering which categorie(s) drove that extremity.
I wonder which profession is actually conscientious? 0.03 for maintenance managers seems pretty low for a top score.
3 Likes
The data fit most of one’s stereotypical expectations, wit a few exceptions ![]()
-
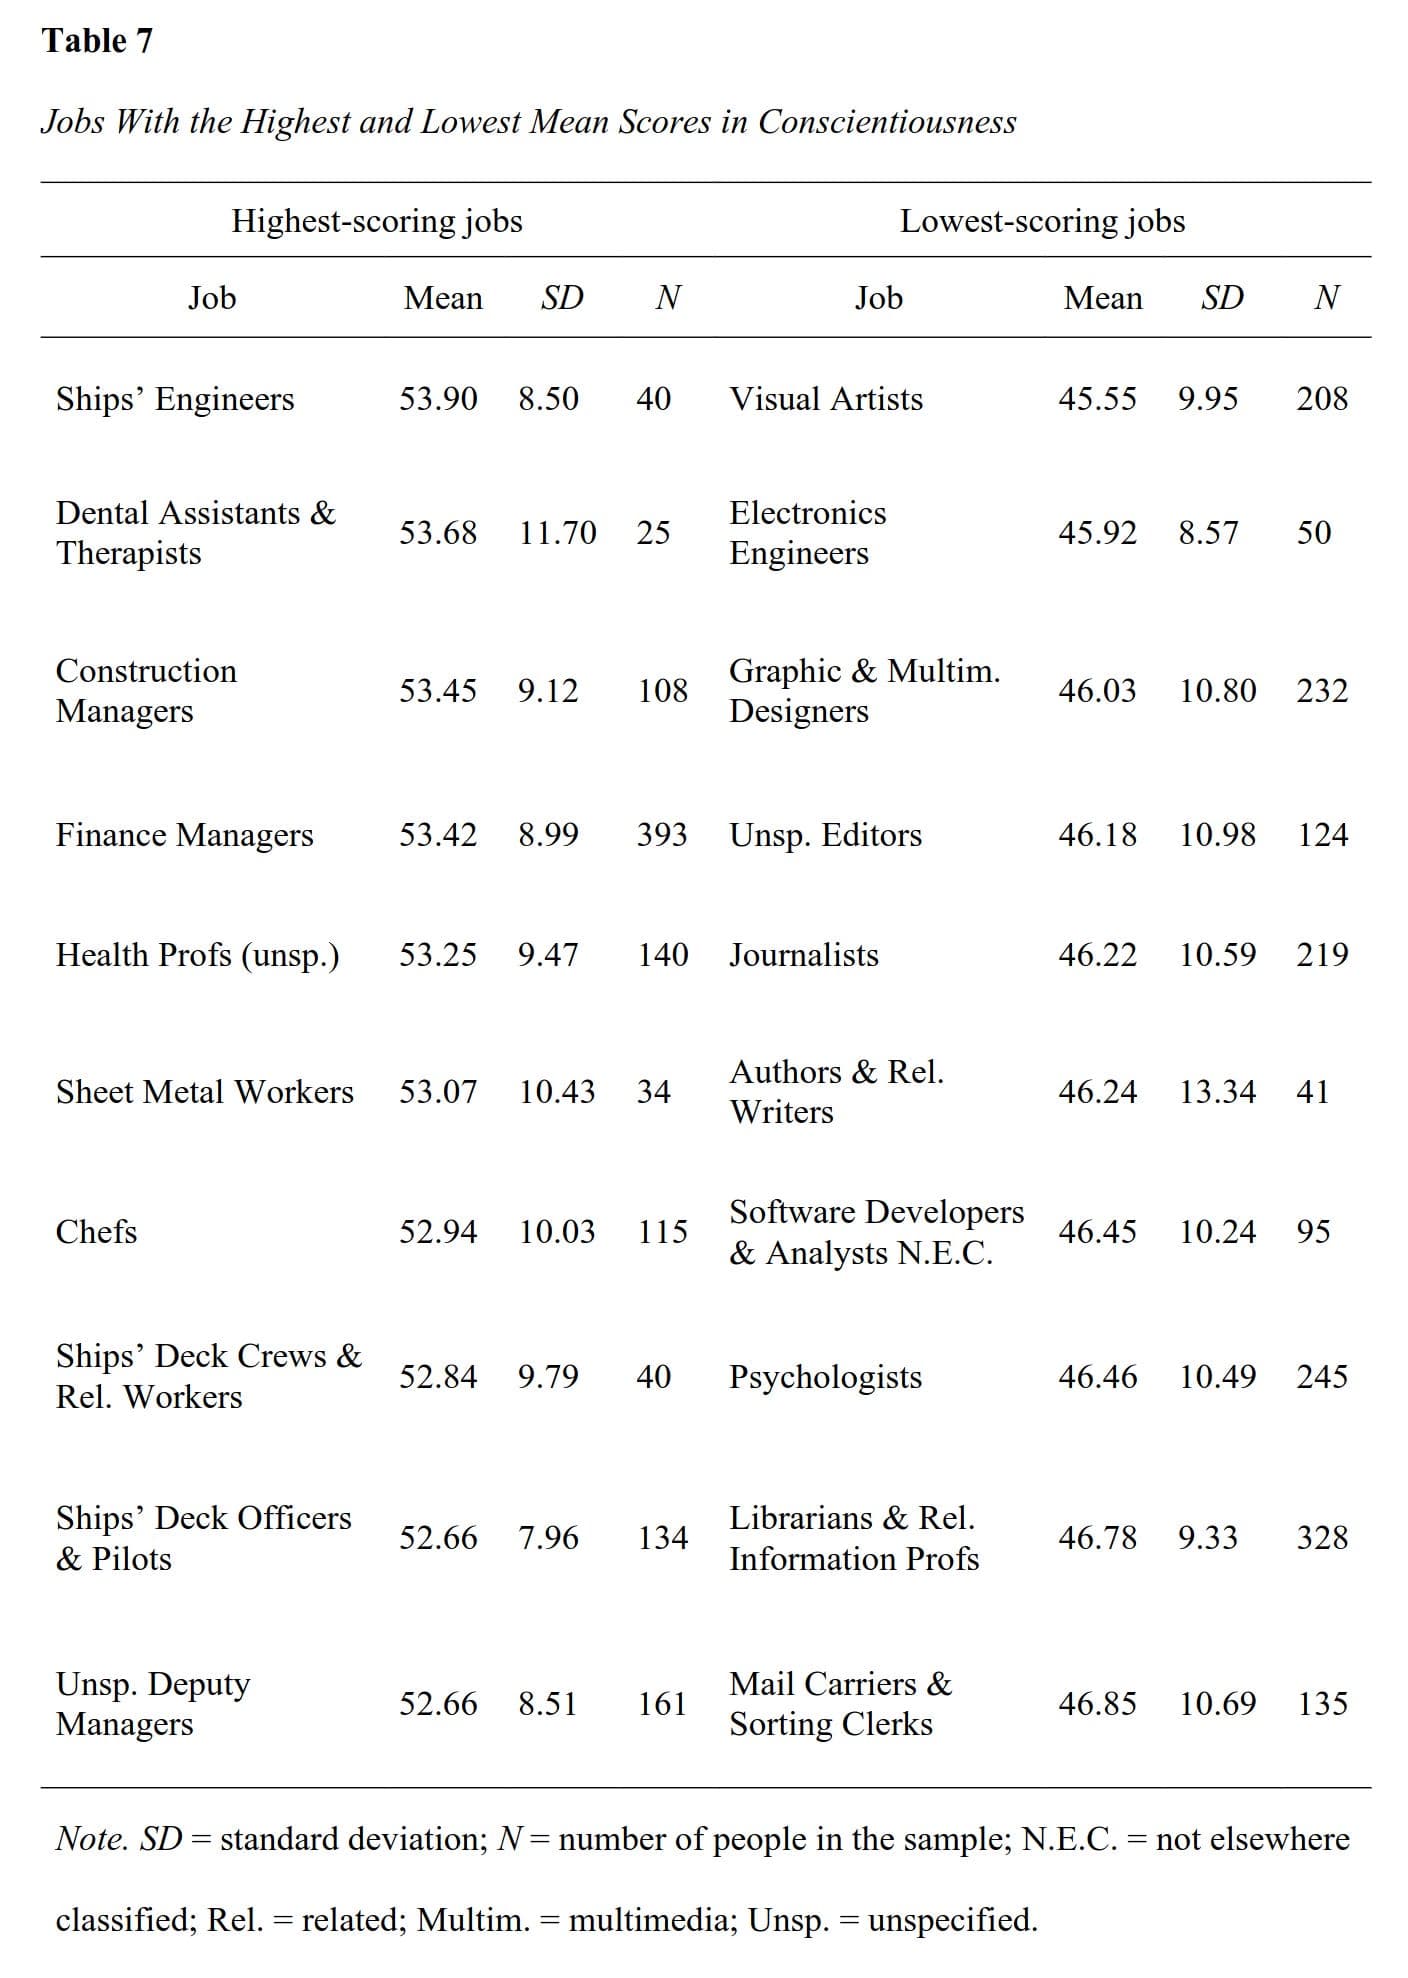
Most conscientious: ships engineers, dental assistants and therapists, construction managers, finance managers.
-
Least conscientious: visual artists, electronics engineers (!), graphic and multimedia engineers (!), editors and journalists
3 Likes
A definition of conscientiousness, from the web:
Conscientiousness is a fundamental personality trait—one of the Big Five—that reflects the tendency to be responsible, organized, hard-working, goal-directed, and to adhere to norms and rules. Like the other core personality factors, it has multiple facets; conscientiousness comprises self-control, industriousness, responsibility, and reliability.
Regarding electronics engineers, when I see a point like that on a scatter plot, I will pay even more attention to whether I have a damaged sample or a data entry error. Exceptional results require exceptional explanation.
3 Likes
10 Likes
I can’t wait for the pedal-powered hair driers and curling irons for the women who hate nuclear power - with, of course, the requisite large, comfortable bicycle seats. Padding is not required. It comes with the users (this latter observation applies equally to the men, lest I be accused of misogyny).
8 Likes
With “The Science” you just drop them from the data set and don’t even add an asterisk. ![]()
4 Likes
These tests are based on self-assessment - and seem to be unable to capture objectively high conscientiousness in an objectively challenging environment where everyone keeps coming short of their self-expectations.
3 Likes
I am very skeptical of all such “scientific” surveys. It might even be true that the statistical analysis of the “data” recorded is first rate. I’m afraid when it comes to such squishy characteristics as to individuals or societies, at base it is GIGO (garbage in…). Desired “results” can be baked into the “experimental” design and show whatever the authors want. This is the kind of stuff you see all the time in the MSM: “scientists say…” Good statistical wizardry (IF that is actually done) adds nothing more than a patina of science, in an attempt to create the impression that the “results” represent something real. What it is is a major example of scientism.
4 Likes
You jest, but this one thing could dramatically change the overall health and fitness of the nation almost overnight for the better…and would be far more economical than how our corrupt health care system currently treats chronic disease. Every home in the nation could be equiped with a stationary bike/generator apparatus for the purpose of “saving the plant”. The unit in question would have biometics to identify the rider and the amount of time you spend on it “giving back to the grid” would, of course, be immediately 5G’d to the cloud and tied to your social credit score and CBDC. I now see the LIGHT, my friends!!! I’ve been wrong about everything my entire life! Our global masters really DO CARE about US!!!
7 Likes
If anyone asks why it’s so hot, point them to the solar cycle chart:
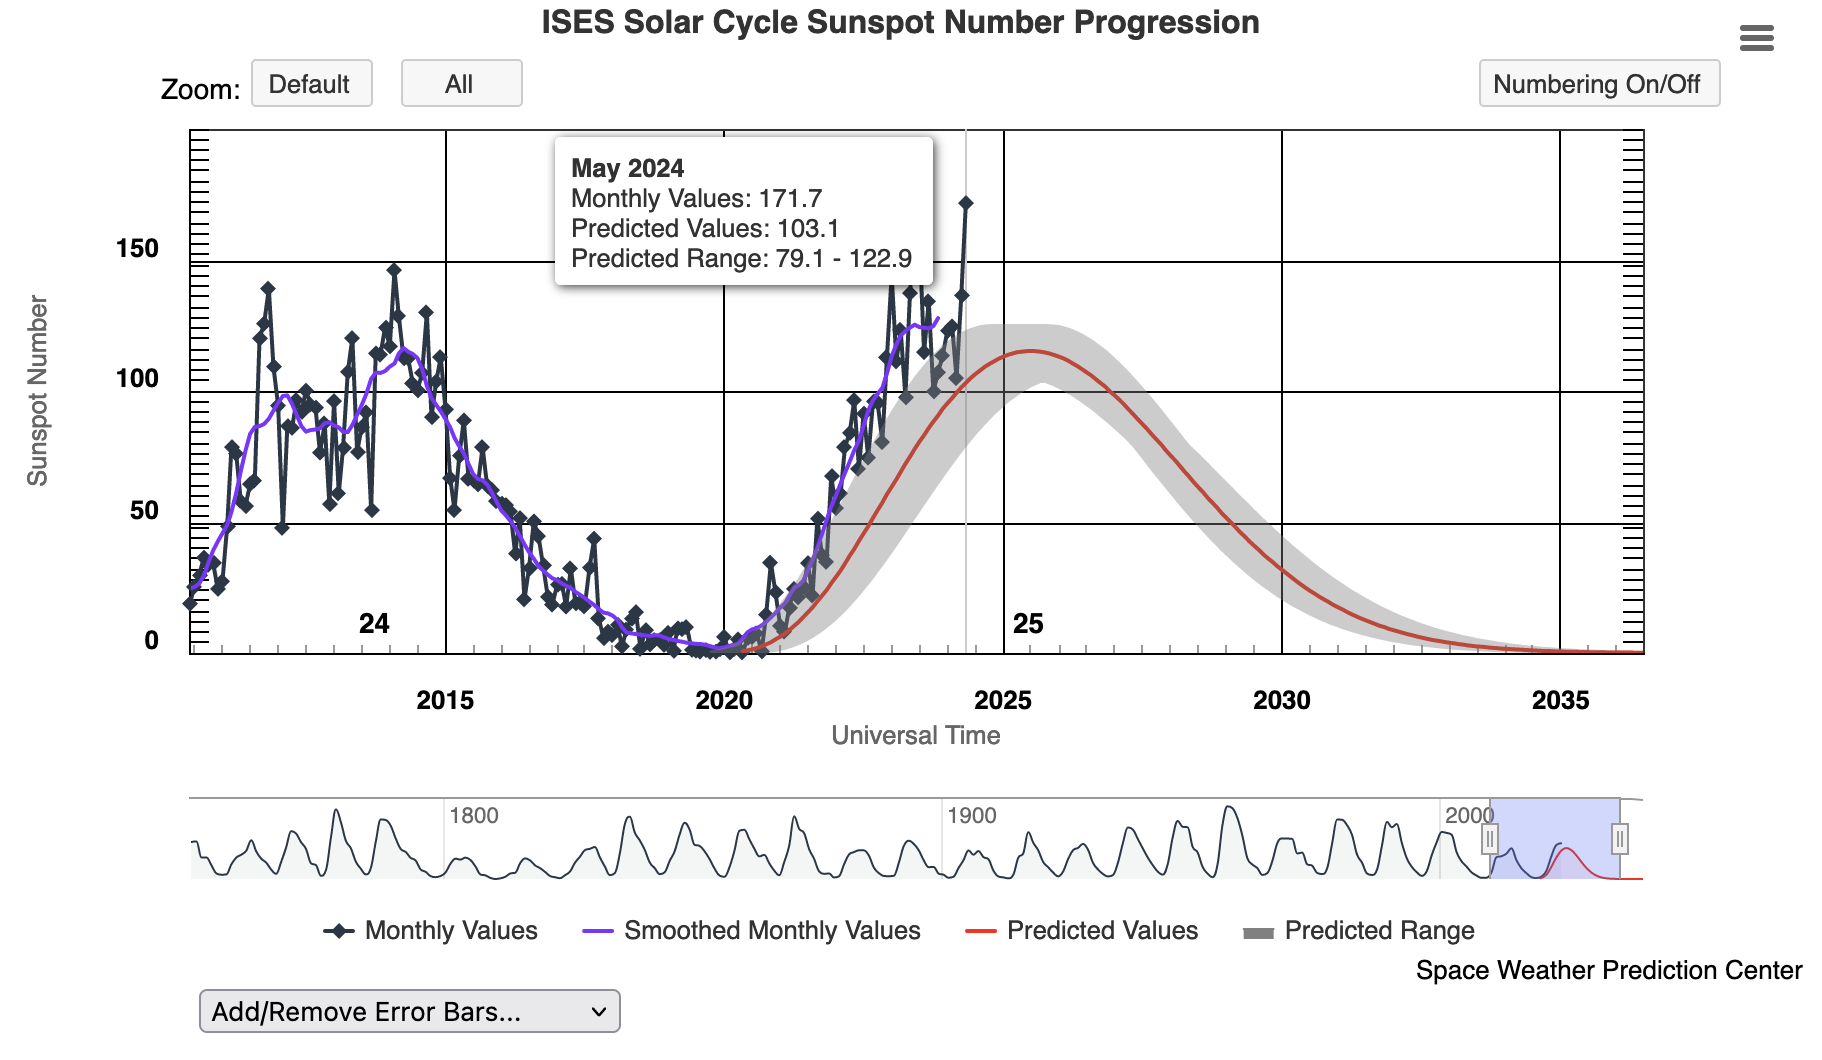
Next summer will be extra toasty: the combination of the solar cycle and the annual cycle on the Northern Hemisphere.
The sun is a little unexpectedly warm this year - quite an offset from the model.
5 Likes
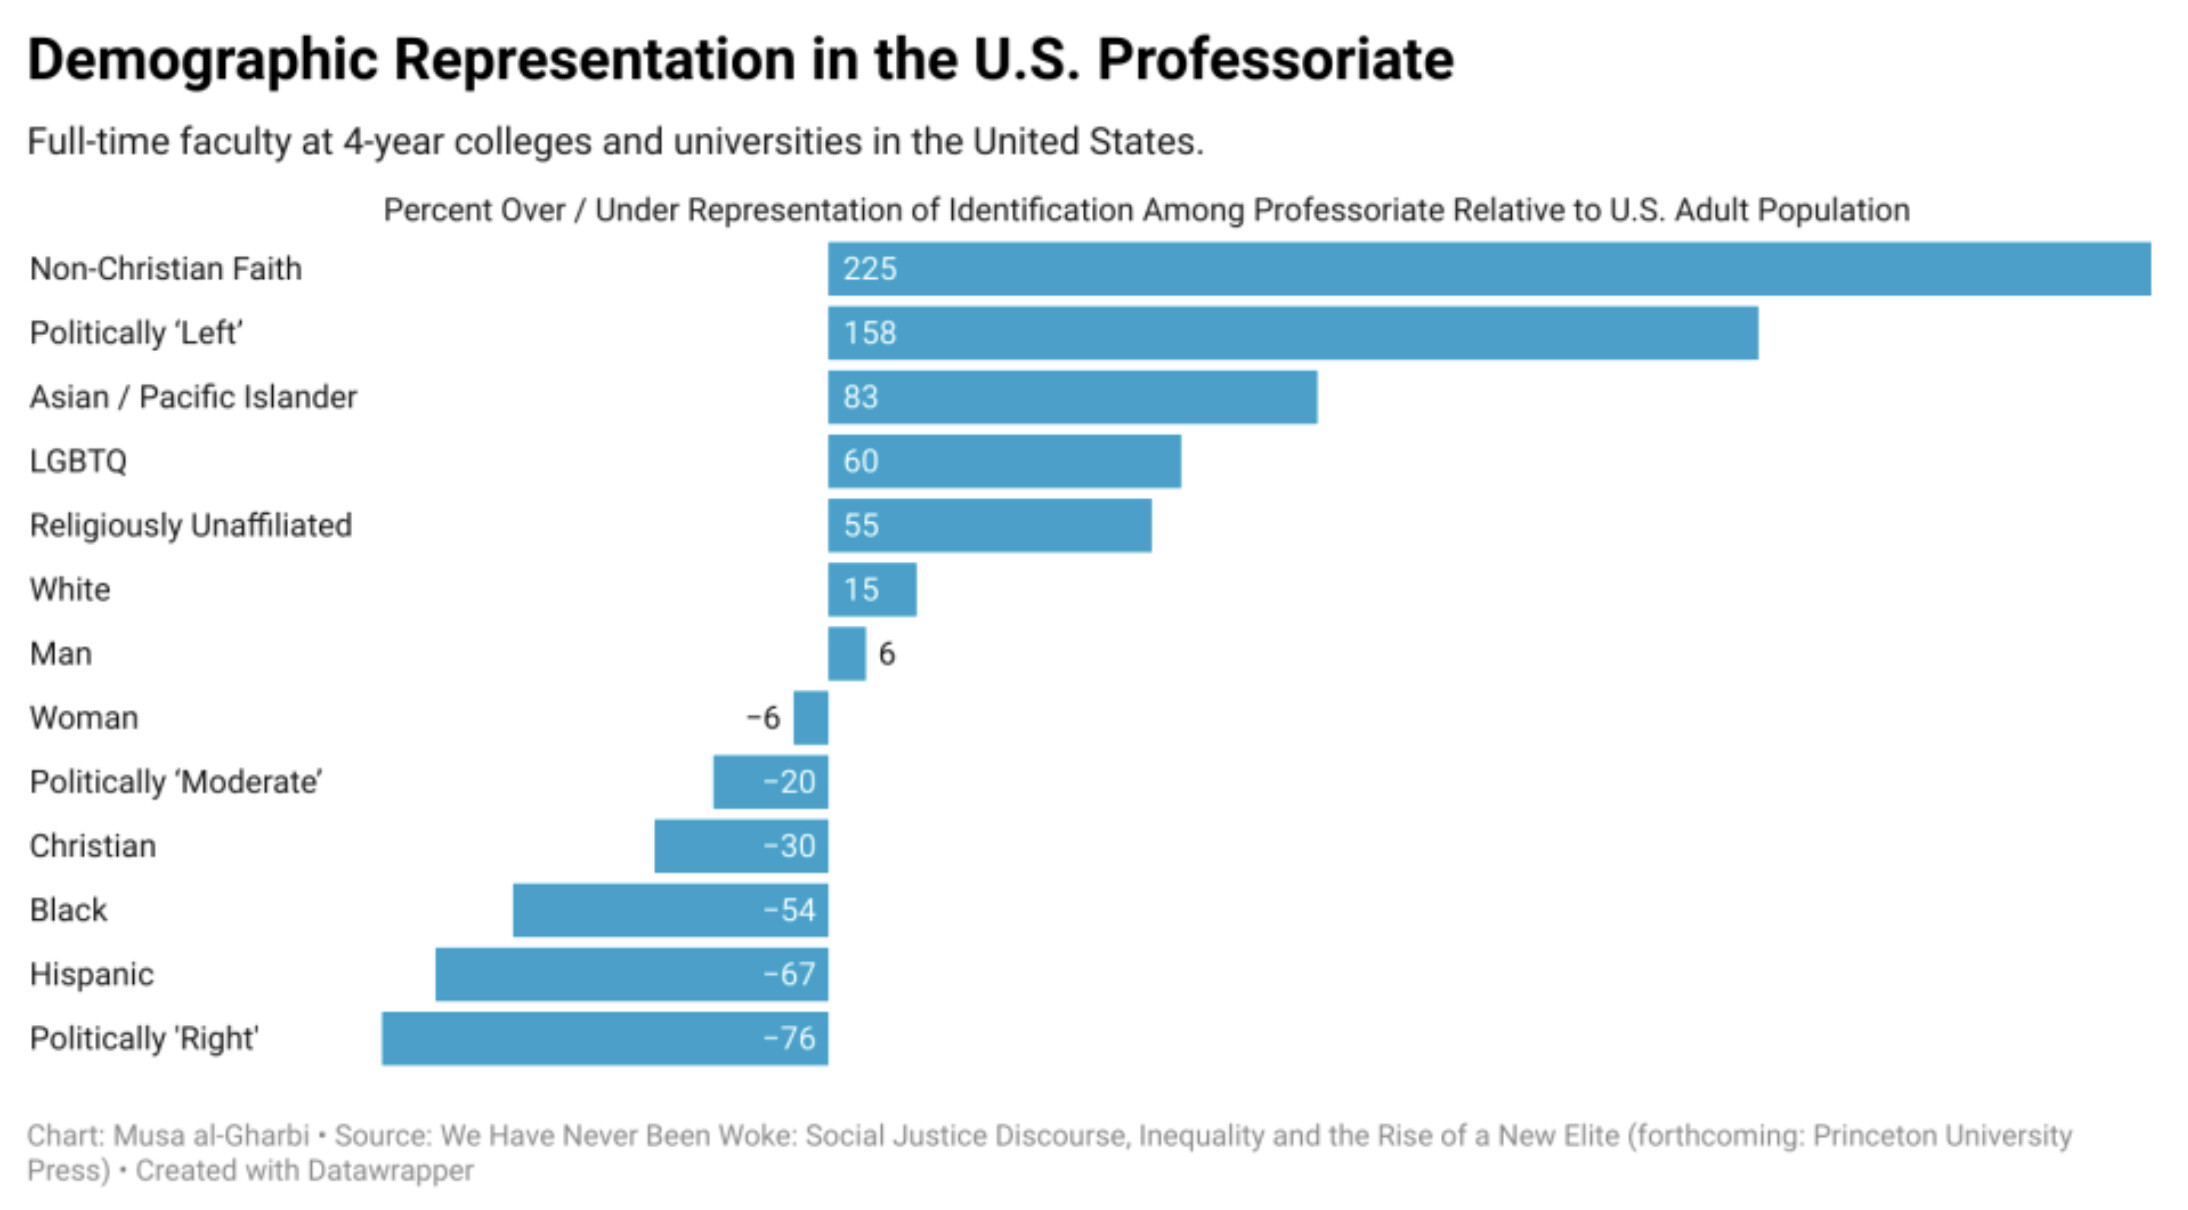
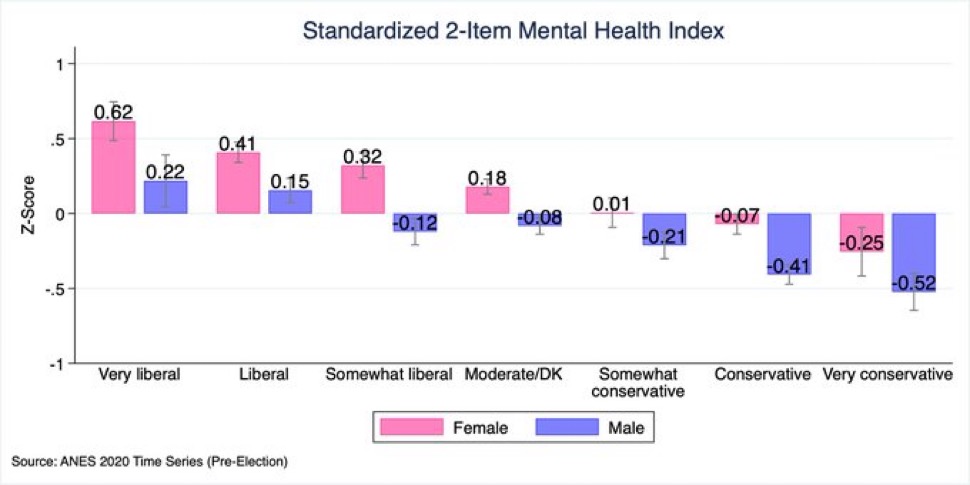
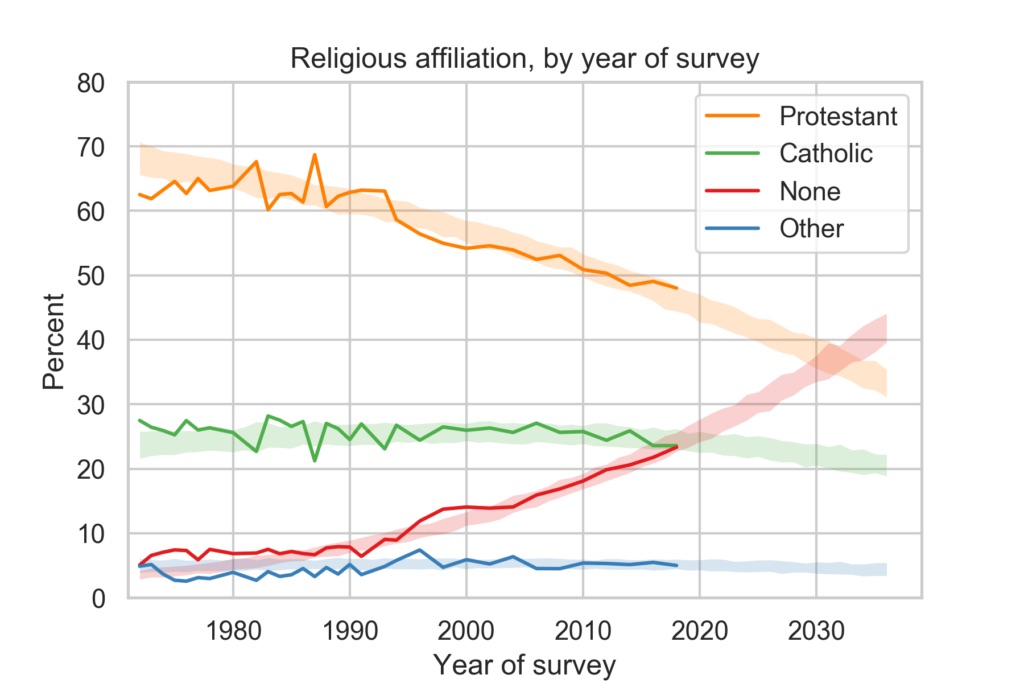
As a current member of the professoriate, I can confirm that LGBTQ are very overrepresented and non-leftists are scarce. However, the latter may because of disinclination to self-identify. The frank talk I often hear as a consequence of being secretly non-leftist has been, shall we say, instructive.
9 Likes

You may have seen the original version of this graph, which used a different scaling for cold and heat deaths in an attempt to exaggerate the latter.
6 Likes
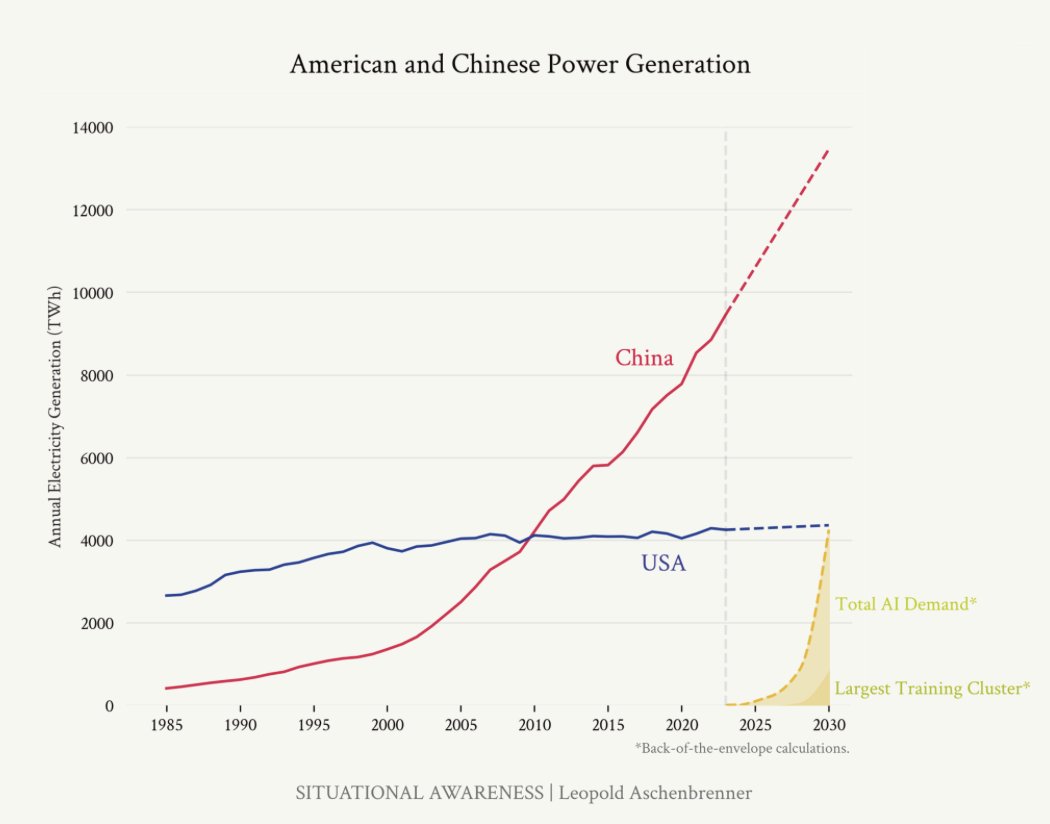
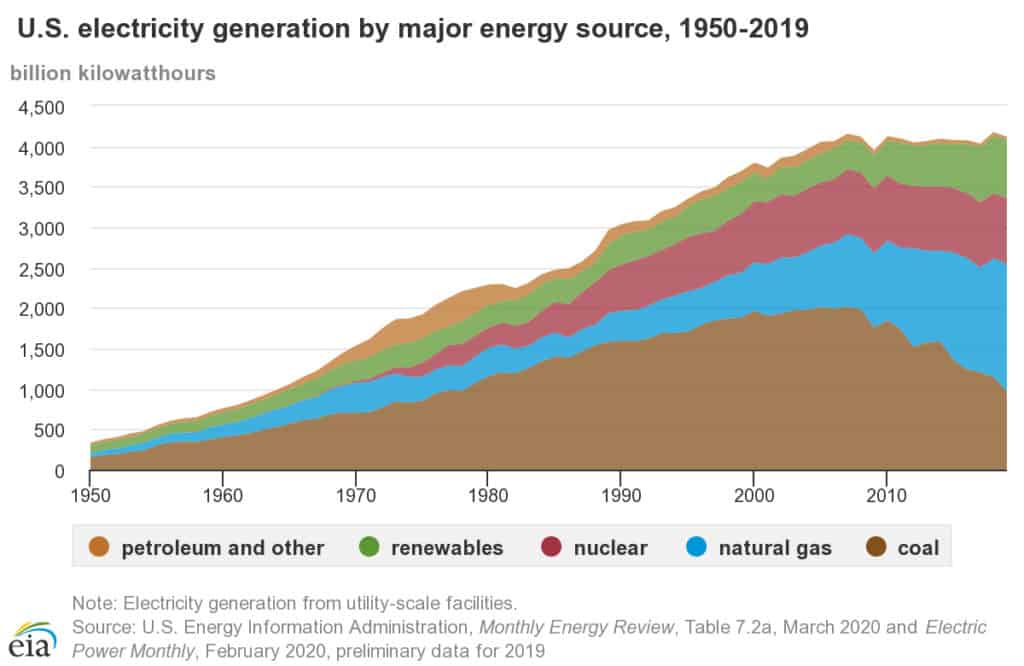
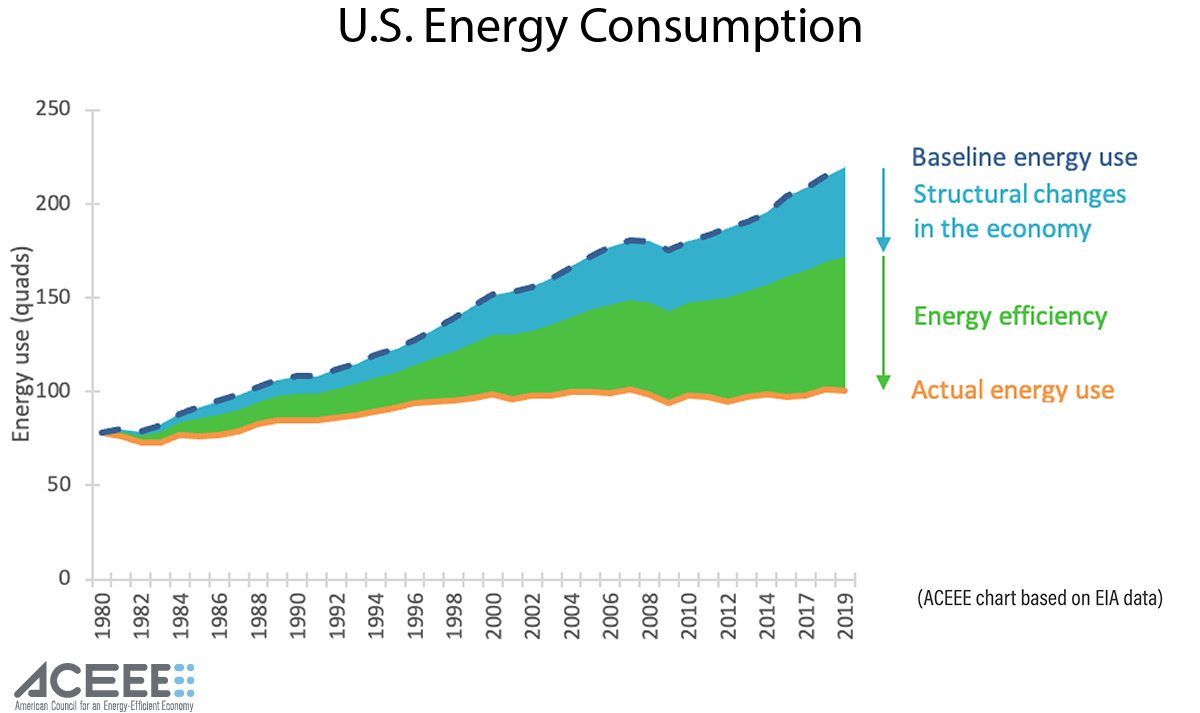
Per the gov, the US economy has grown at an compounded annual growth rate of over 4.5% in the last 20 years. Yet we don’t use any more power? The idea that we offset the power demands that would come with economic growth with efficiency improvements this large is just so much bs.
If this were true home electricity usage would be 1/4 or less of what it was in 2000 with an average home size 21% larger and the number of homes up by 25%. TVs screen size has doubled and the size and computer monitors are between 50 and 100% larger. The penetration of computers into homes has went from 50% to closer to 75% and the average number of computers per home is now ~2. Plus, the power usage of the computer itself has grown by 30 to 100 percent.
All this increase in demand for electricity in an average home is not only offset but is now 25% of what it was 20 years ago by energy efficient appliances which are maybe 20 to 40% more energy efficient? Give me a break.
I am not sure that each of the above numbers is precisely correct. They seem about right. Deindustrialization: The replacement of an arc furnace by a tattoo parlor is the explanation.
7 Likes
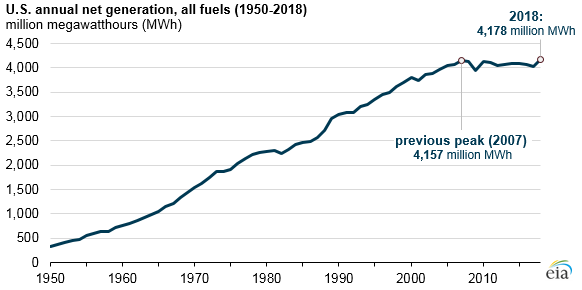
The US curve struck me as odd as well. Here are a few more graphs, which present similar trends but also support your interpretation. That said, I’d like to again note I do not necessarily believe or endorse everything I post in this thread.
4 Likes


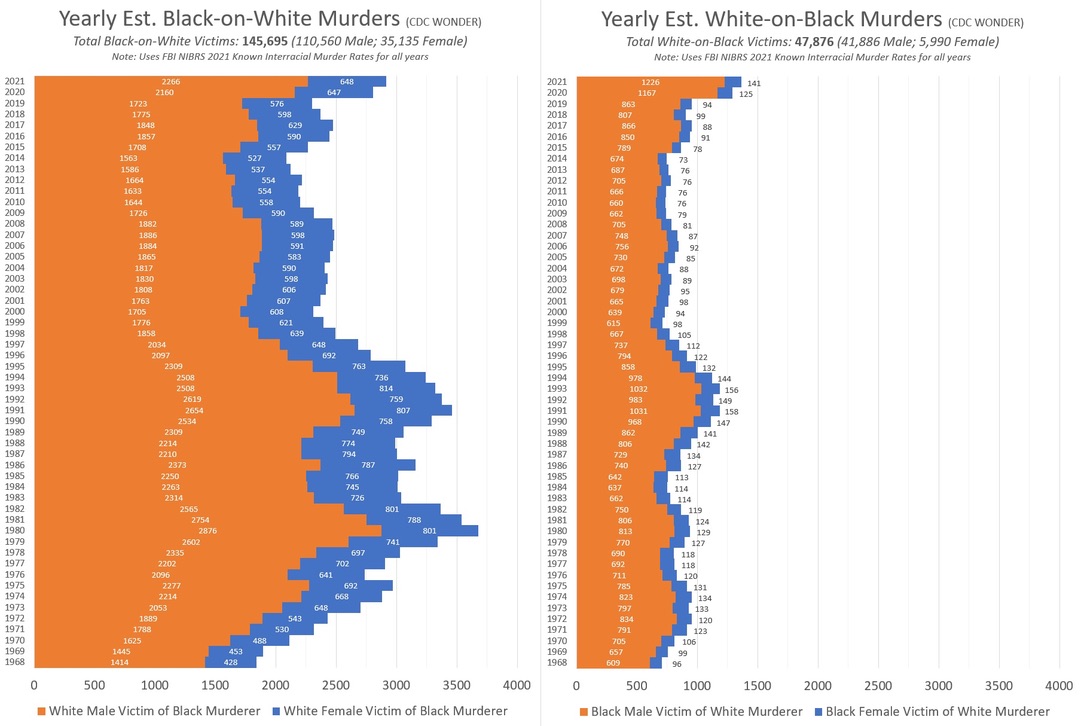
If a white guy shoots a black guy in self defense does that count as homicide , white shooter and black victim?
1 Like