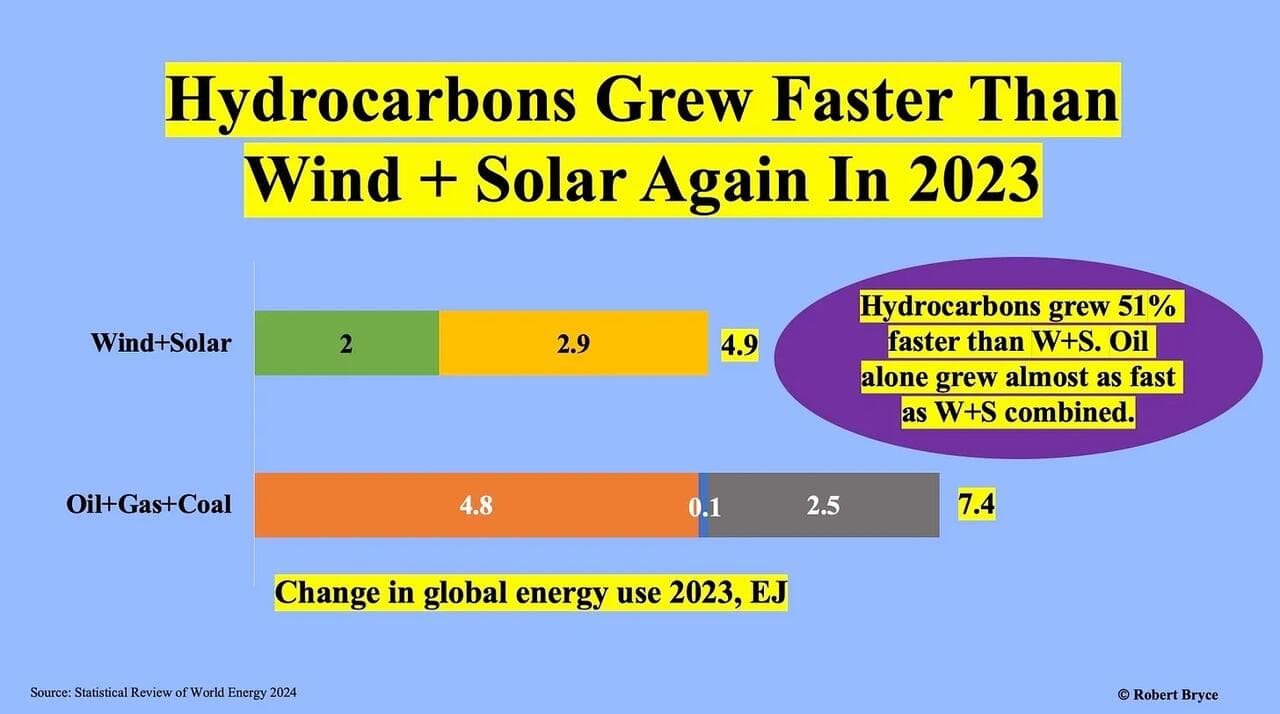
When listing capacity, are the solar plants shown by their peak (local noon) capacity or their average over a whole day? Fuel-powered industrial generator’s capacity is 24/7/~355. (A week or two for maintenance each year.) Solar peak capacity is at most 4 hours, and way fewer days per year. (With exceptions for deserts–that are hard to connect to the grid.)
And I dispute the categorization of battery storage as “capacity”. Battery is simply an enabler for averaging wind and solar capacity.
The goobers can only talk about nameplate capacity. Otherwise people might see the obvious.
The below graph is USE, not capacity. The world is either adding capacity not required or more likely capacity that cannot be used. Mostly it reflects the difference between nameplate capacity and actual real world production capability.
The more important number is total government spending then divide by GDP
A deficit with a small budget is much better than a surplus with a large budget.
Clinton was not a fiscal hawk. Newt Gingrich kept spending under control sort of. Surplus occurs when there is gridlock. Gridlock is a feature not a bug.
There is no such thing as an unbalanced budget. Every budget is balanced via taxation, borrowing and inflation.
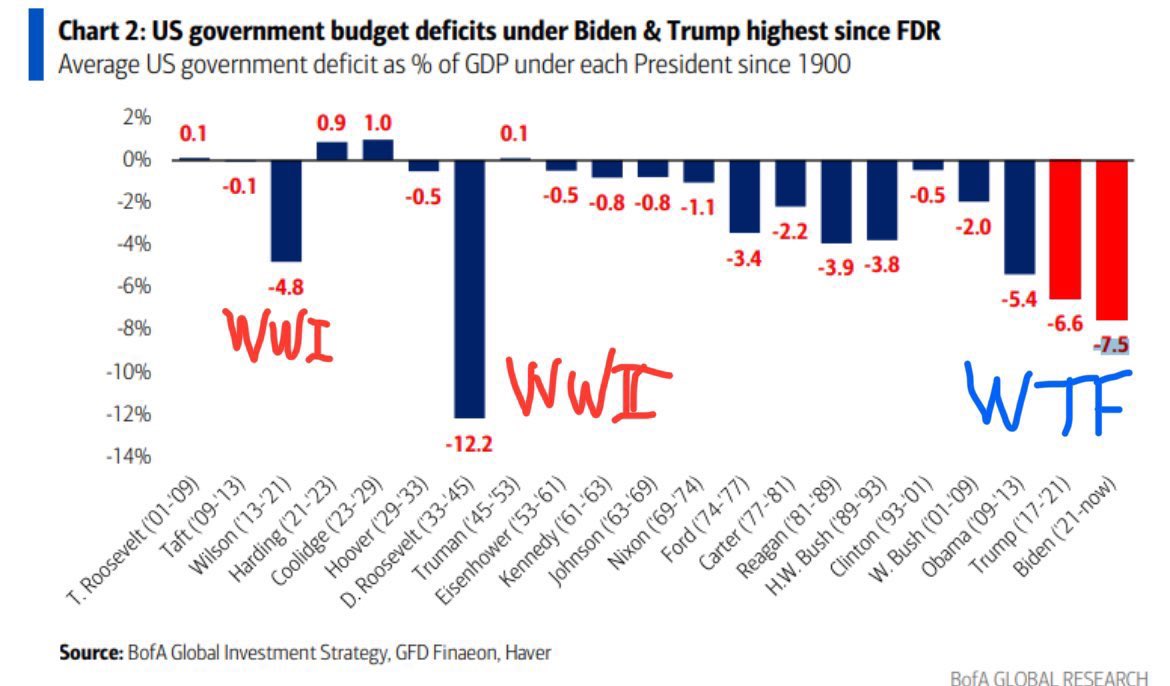
According to the search results, the US budget deficit as a percent of GDP by year is as follows:
2015: -2.4%
2016: -3.2%
2017: -3.5%
2018: -3.8%
2019: -4.6%
2020: -14.9%
2021: -12.3%
2022: -5.5%
2023: -6.30% (actual)
2024: -6.00% (projected)
2025: -5.80% (projected)
2026: -4.80% (projected)
I give a pass on 2020 and 2021 even though it was an outrageous response. Trump average was 3.96 and Biden 5.93 (using 2024 projection which I will bet will be low).
Based on the search results, here is a summary of USA federal expenditures annually since 1900:
Federal spending has grown significantly over the past century. In the early 1900s, annual federal outlays were only a few billion dollars. By fiscal year 2018, federal spending had reached $4.11 trillion[3].
Some key figures and trends:
1930: $3.3 billion in outlays (3.4% of GDP)[1]
1940: $9.5 billion (9.6% of GDP)[1]
1980: $590.9 billion[1]
2000: $1.79 trillion[1]
2018: $4.11 trillion (20.3% of GDP)[3]
2022: $6.27 trillion[3]
Federal spending as a percentage of GDP has generally increased over time:
1930s: Around 3-10% of GDP
1940s-1950s: Increased to 15-20% range
1960s-present: Typically 18-22% of GDP[1][3]
Major categories of modern federal spending include:
Social Security
Medicare and Medicaid
Defense
Interest on debt
Other discretionary programs[3]
Mandatory spending on entitlement programs like Social Security and Medicare has grown to comprise about two-thirds of the federal budget in recent decades[3].
The federal government has run budget deficits (spending exceeding revenue) in most years since the 1960s, leading to growth in the national debt[3].
Democrats and some Republicans are going to say the responsible policy is to raise taxes to pay down debt. Nonsense. Cutting spending will get us there.
Be very suspicious of “GDP”. There is something strange about quantifying “Gross Domestic Production” by actually measuring Gross Domestic Consumption.
Apparently, the definition of GDP has always been contentious within certain academic circles. Should government expenditures be counted as part of GD Production? When government taxes genuine production and spends that money on unproductive overhead, is it meaningful to count the government’s spending as part of “Production”? Or is that a form of double-counting?
Everything consumed had to be produced. But everything produced doesn’t have to be consumed.
Government spending is simply redistribution of money from x to y. They want you to believe it is from wealthy to poor, but a significant portion is from middle class to wealthy.
The problem I have with GDP (other than the manipulation that can happen with things like the GDP deflator) is not all spending/production is equal. This is similar to the broken window fallacy which is the idea that a broken window adds to the economic output because someone has to produce the glass and someone has to install it etc. This fallacy ignores that that spending could have been an improvement. Maybe hiring the kid that threw the rock to sweep the floors.
Think about all the dumbasses that say the Ukraine war spending isn’t bad because all money comes back to the US corporations to build the weapons. Even if this is true, weapons are a really bad investment. At best they are an insurance policy and at worst they are a terribly negative investment. Worse than throwing money away because you sucked up people and resources that are now gone forever.
Regarding GDP calculation, consistency is more important than accuracy for this exercise. I guess we can take the nominal budget dollars and adjust for inflation.
TL;DR nominal dollars are increasing and ratio of spending/GDP is increasing. Spoiler alert.
Window replace and install services benefit.
Military industrial complex benefits.
No one else benefits. If they do the benefit is trivial and political.
I like how we compare Ukraine to a broken window. The metaphor fits!
The broken window fallacy refers to the mistaken belief that economic destruction, such as breaking a window, can be beneficial for the economy. Frédéric Bastiat’s parable of the broken window illustrates this fallacy - while the glazier benefits from repairing the window, the shopkeeper loses the opportunity to spend that money on something else, resulting in a net loss to society.[1][2]
The key insight is that the money spent on repairing the window comes at the cost of other potential purchases the shopkeeper could have made. Bastiat argues that “destruction is not profit” - the immediate seen benefit to the glazier is outweighed by the unseen opportunity cost to the shopkeeper and the rest of society.[1]
This fallacy also applies to larger-scale destruction, like war or natural disasters. While the rebuilding efforts may boost certain industries, the resources used could have been allocated to more productive ends if the destruction had not occurred in the first place.[3][5]
The broken window fallacy emphasizes the importance of considering unseen, indirect effects and opportunity costs when analyzing the economic impact of an event, rather than just focusing on the immediate, visible consequences.[1][2][3][4][5]
I think the deflater is meant to count for inflation, but we know that is not accurate. If inflation is 6 percent in place of 3, we are in a recession.
You cannot view the gdp calc as consistent when the deflator is calculated inconsistently. Meaning one year x is included and the next it isn’t.
I would us change in money supply as a deflator. You add 10 more dollars you should get 10 dollar increase in gdp.
When a loan is taken, the dollars are created and deposited. The fact that they somehow are not seen in consumption means they didn’t get spent on something tangible. Where did they go? Likely financial loans to buy paper assets which will show in money supply but not in GDP.
That is off the top of my head, but I suspect that is what has been happening. Money supply is increasing and a lot of it goes into the stock market.
The point really is that the goal should be to measure useful GDP versus malinvestment in its many forms.
I posted on the inflation adjusted cost of the Milwaukee Road’s pacific expansion. How the that cost couldn’t pay for the rail of the California high speed rail. I suspect this huge difference is really the difference of saying the cpi is inflation in place of money supply. I have been meaning to calculate a money inflation cost of that expansion.
GDP is problematic for the reasons you mention… I know economists like to highlight debt to GDP ratio but spending is the critical number we want to monitor. Keep your eye on government spending!
Why are the feds spending more today than in 2020 and 2021, pandemic stimulus years?
We have to manage the coronavirus, all fiscal common sense must be abandoned!
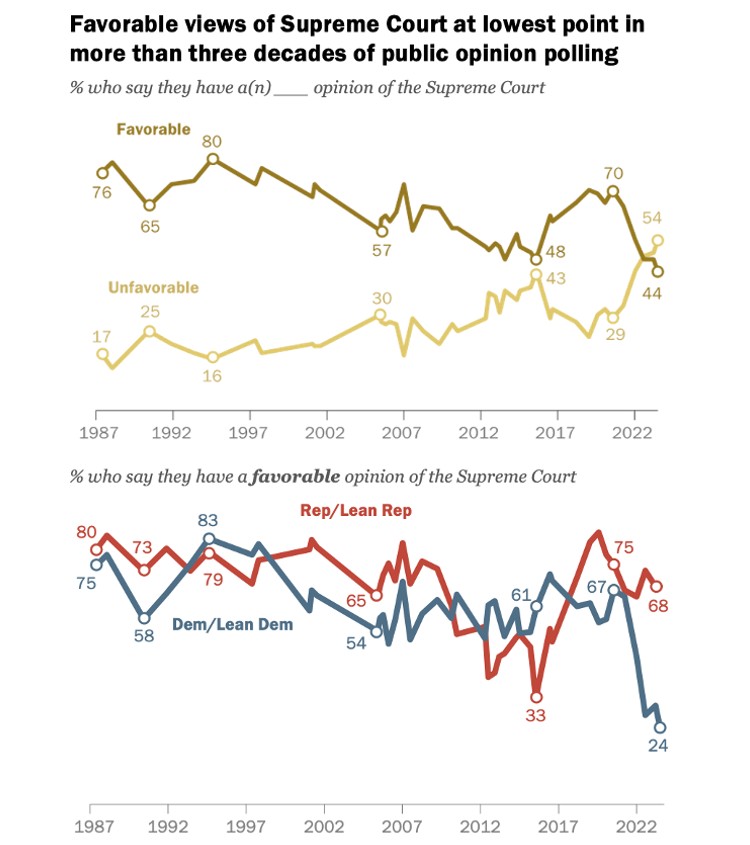
Current Supreme Court has blocked some of the lawfare wage against DJT
overturns Roe and Casey
overturns Bakke and Grutter
The biggest deal was overturning Chevron deference
I predict this will be seismic and is more important than Dobbs and Students for Fair Admissions
We need to eliminate the 4th branch, drain the swamp
non sequitur = Podunk, Connecticut, an area in the town of Guilford in New Haven County