Volatility in Credit Default Swaps

CDS_rates_2022-03-07

A credit default swap (CDS) is a financial derivative contract in which the seller agrees to compensate the buyer, who pays a fixed premium in advance for the contract, if an underlying security (usually a debt instrument such as a fixed-rate, fixed-term bond) defaults (fails to pay interest, return principal at maturity, delays payments, or makes partial payments). Given the complexity of the instruments and possible events over the term of the contract, these contracts are usually very complex and may be customised by the buyer and seller, but the general concept is simple: it amounts to the buyer purchasing insurance from a third party against the risk of default by the issuer of the underlying security. As with any form of insurance, the buyer must also weigh the risk of the seller failing to pay when the risk becomes reality—this is referred to as “counterparty risk” and can be substantial when things get spicy in otherwise staid financial markets.

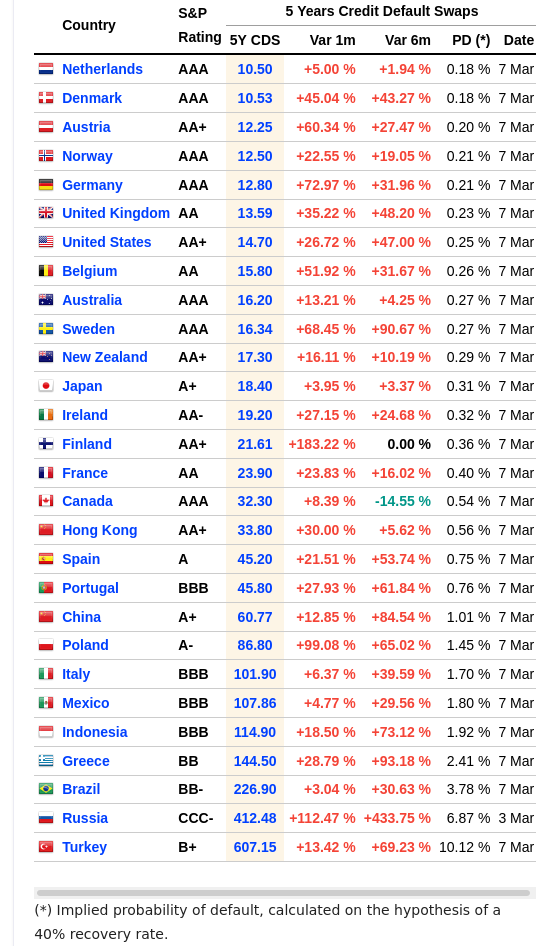
Although credit default swaps are complicated and can be customised, to allow comparison across issuers, securities, maturities, and time, they are often quoted in terms of basis points of premium on a contract with an underlying nominal value of US$ 10 million. For example, at this writing, a five year credit default swap on the sovereign debt of the United States is quoted at 14.70 basis points. Since a basis point is a “percent of a percent” that means the buyer pays 14.70\times\frac{1}{100}\times\frac{1}{100}=0.00147 of the amount insured for the contract. For the standard principal of US$ 10 million, this would be US$ 14,700 for the contract. (While credit default swaps are structured like insurance, you don’t need to own the underlying asset to buy a swap on it. A swap bought as a speculation on default of the asset is called a “naked swap”, and such swaps are estimated to account for around 80% of the total swap market.)

What’s interesting is comparing the swap rates, and implied risks, of the sovereign debt of various countries and the changes in these rates over time. U.S. Treasury debt is often said to be the safest investment in the world since it is denominated in the world’s reserve currency and the issuer has the ability to print new dollars at will to redeem its debt. And yet, given the political instability of that country and its history of brinksmanship and grandstanding over government shutdowns and increasing the statutory debt limit, credit default swaps on its bonds cost 40% more than those on the debt of the Netherlands, currently considered the least likely to default in the world. (If you really believe that climate change and rising oceans posed a real threat, why would a country more than one quarter of which is below sea level be the safest bond issuer in the world?)

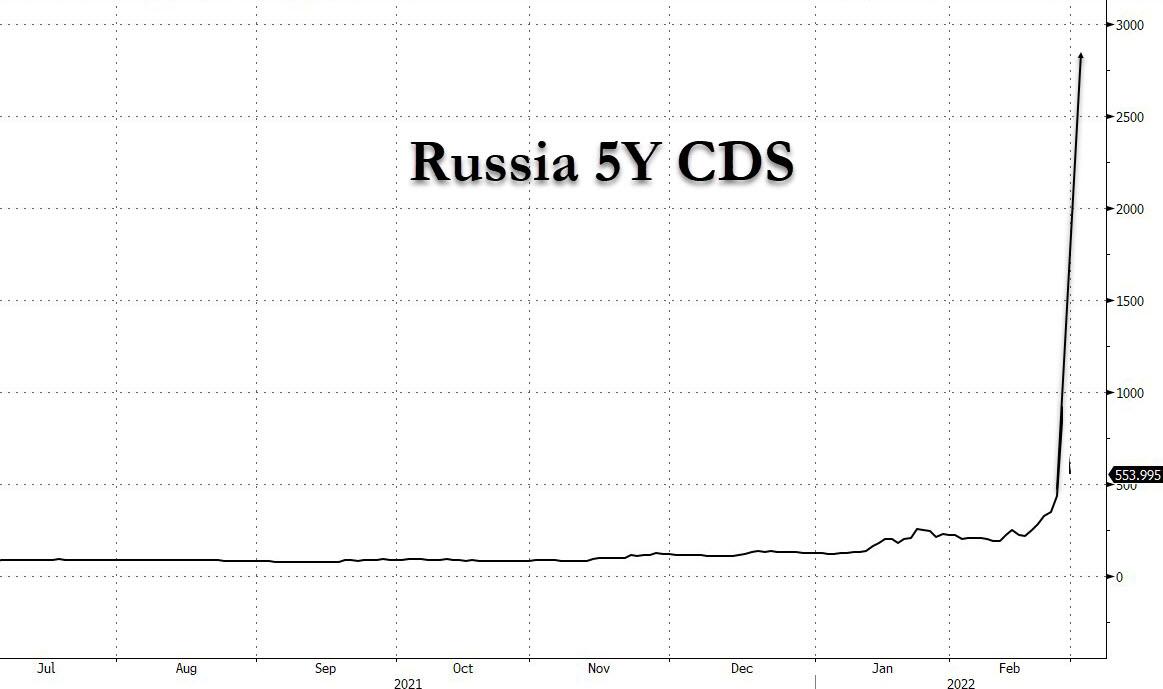
Anyway, comparing risk, as assessed by traders in the market with their (or their clients’) money on the line, is interesting, as is the rate of change in that perceived risk. Other than dramatic recent changes due to geopolitical events (see Germany, Poland, Finland, and Russia), what is also obvious is that recent instability in the foundations of the financial system (in particular, freezing the foreign exchange reserves of Russia by the central banks which held it on their behalf) has caused a world-wide increase in the perceived risk of sovereign defaults with only a few exceptions, notably Netherlands, Japan, and Canada.

The “PD” column in the table gives the estimated probability of default implied by the CDS rates according to a complex formula assuming creditors recover 40% from an eventual default. While the probability for the U.S. is just 0.25% and China is 1.01%, Russia’s default probability now stands at 6.87% (although it is unlikely many new CDS contracts are being issued on Russian debt, and the number comes from a thin and volatile market).

This is an interesting indicator to watch, as it indicates confidence in the foundations of the international financial system that underlies world trade.

5 Likes

…and then…

2 Likes

What is not clear is just who will be hurt if Russia defaults on its debt? Russia got the money and spent it. Whoever now holds that debt and expects to get regular interest payments is the entity which will feel the pain first – or maybe the entity which has insured the loans to Russia – or maybe the entity which has speculated in CDS. It seems quite likely that the people closest to that financial Ground Zero will not be in Russia.

The immediate losers will be whoever sold the credit default contracts, as they’ll be on the hook to the buyers to make up the loss. Given the deterioration in Russia’s credit risk even before the recent collapse, it’s likely that the swap dealers have been putting on hedges (for example, buying put options on Russian sovereign debt, which will appreciate if it goes into default), but there’s no way to know until it’s time to start unwinding these contracts. Anybody who owns the debt and doesn’t have a CDS to insure against the loss is the next round of losers. In many cases holders in such a situation will sell the debt at a deep discount to a “vulture fund” which bets that more will be recovered from the in-default bonds than the market expects. (Some such funds have done well in past Latin American and Asian debt crises.)

Many banks who may hold this debt are subject to “mark to market” rules and may not be able to carry the debt at full value on their books hoping it will be eventually recover. Those banks will have to reserve for potential losses, which will hit their earnings.

A recent post on ZeroHedge, “Traders Concerned Russian CDS Won’t Pay Out In Event Of Default” discusses a Financial Times article (behind a paywall), on the various ways holders of credit default swaps may be left holding the bag due to sanctions, disruption of markets, and counterparty risk.

When things are moving this quickly, it’s nearly impossible to make predictions or forecast what might break.

2 Likes

If you’re curious about how the probability of default is computed from the quoted price of a credit default swap (CDS), here’s they do it, as described in this quant.stackexchange post. The price, usually called the “CDS spread”, is S and R is the expected recovery rate from a default event, expressed as a fraction or percent. In the case of a total default, R would be zero; in quoted probabilities of default R=40\%=0.4 is often used.

To compute probability P of default over time period t in years, use:

P=1-e^{\frac{-S t}{1-R}}

To compute the CDS spread S from default probability P recovery rate R and term t years, use:

S=\ln (1-P)\frac{R-1}{t}

The S value for CDS spread is expressed as a fraction, not in terms of “basis points” as usually quoted in the financial press. To convert basis points to fractional value, divide by 10,000. The term value t is also confusing in published data. The financial community is inordinately fond of curious units—in addtion to basis points, these are the people who quote U.S. Treasury securities prices in 1/32nds of a dollar. While credit default swaps are often quoted in terms of a five year swap, the CDS spread S and probability of default P are quoted as if the term was one year, so with such published data you should set t=1 in the above equations.

Let’s work an example from the table in the main post. Poland’s sovereign debt was quoted at 86.80 basis points for a 5 year CDS. To compute probability of default, we convert basis points to S=86.80/10000=0.00868, set t=1, R=0.4 and evaluate:

P=1-e^{\frac{-0.00868\times 1}{1-0.4}}\\ P=1-e^{\frac{-0.00868}{0.6}}\\ P=1-0.9856\\ P=0.01436=1.436%

Why does this not agree exactly with the 1.45% quoted in the table?—sloppiness.

Let’s do the inverse calculation just to be sure.

S=\ln (1-0.01436)\frac{0.4-1}{1}\\ S=\ln 0.98564\times -0.6\\ S=\ln -0.014464\times -0.6\\ S=0.0086784

Or, in finance-speak, 0.0086784\times 10000=86.784 basis points.

2 Likes

Got to love it! We see this kind of apparently sophisticated calculation in many industries. But right down at the bottom of the process are often some very arbitrary assumptions – in this case, that 40% of the loaned money will eventually be recovered in the event of default.

So the obvious question is – Where does the assumption of 40% come from? When I have asked related questions in other contexts, the people presenting the results usually shrug their shoulders and say – We always use 40%.

And if it is ever possible to find the person who originally blessed the 40% number, it turns out to be from a historical analysis of a large number of prior occurrences – with a range that goes from 0% to maybe 90%. And that person will clearly say that it is ok to use 40% provided (a) one is looking at the average outcome from a diversified portfolio of at least 20 independent entities, and (b) that there are good reasons for projecting past performance to predict future likely behavior.

But hiding arbitrary assumptions behind equations (the more complex the better!) makes it seem so much more credible.

2 Likes

There are also even more complicated models with forbiddingly arcane equations behind simplified calculations such as this one. See, for example, the Hull-White pricing model [PDF], which is one of the most commonly used in pricing these contracts. And behind that is the assumption, buried all over the place, that the distribution of the numbers they are aggregating into the ensemble values they employ are Gaussian and well-behaved, when there is abundant evidence that, like so many things, a power law is a better fit.

1 Like

This touches a hot issue with me. I was once a bystander at an enormous business catastrophe – lost a Billion Dollars. It turned out that the executive who placed the bet did not realize he was placing a bet. He expected the “Expectation Value” result from a Monte Carlo analysis, without realizing that the Expectation Value could be expected only as the average result if he had placed a large number of similar bets. Any single bet would have a result anywhere from total loss to an El Dorado-like gain. This executive’s failure to understand the assumptions involved in simple statistics ended his business.

2 Likes

This is very interesting. Thank you for sharing.

I think I am confused by the units. When we use the basis points for a five year swap, are we calculating the probability of a default over a one year period?

2 Likes

I don’t know. What’s odd is that the term of the swaps quoted is five years, so you’d expect the default figure would apply to that term, but the spreads and probabilities quoted are computed with a term of one year. I don’t know if that means the probability applies for one year or five. My guess would be for one year, since the five year term appears nowhere in the formula used to compute the probability.

2 Likes