The Crazy Years

6 Likes

image

Note that the arrows, which used to go to the right, now point to the left.

10 Likes

https://www.yahoo.com/news/er-visits-risen-sharply-young-181429244.html

5 Likes

image


Robert Habeck, the German “ Federal Minister for Economic Affairs and Climate Action”, is a former leader of and member of parliament representing the Green party.

11 Likes

I hope ze Germans get the government they wanted good and hard. But then I’m reminded, they probably live in the same deep state controlled election system we do in the US (Unsuspecting Suckers).

8 Likes

Look at what happened in 1930!

image

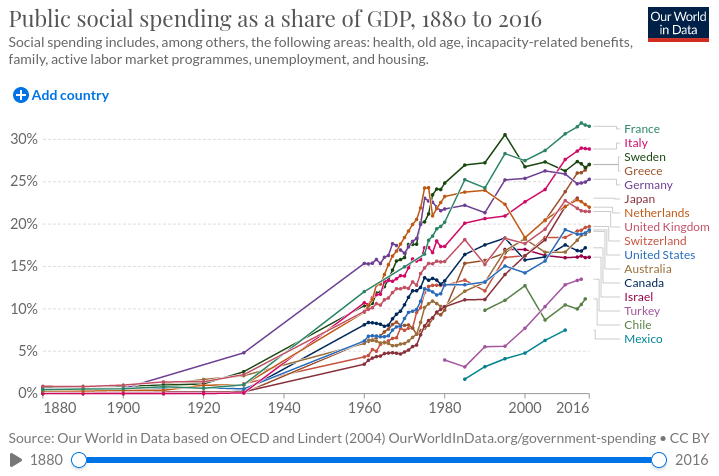
On the interactive chart page, linked to the image, you can mouse-over the names of countries to highlight their line on the chart, or over regions on the graph to display values for countries at that time (time resolution is lower for older data.)

10 Likes

Seems odd that at the same time (relatively) despite governing systems, they all acted exactly the same. You know it looks as though they were all acting towards the same goal. But nah, that’s conspiracy talk! This just happened like everything else in global politics despite these freaks meeting at the UN, Davos, various regional confabs, etc.

10 Likes

Any government that can print money will print money until it blows up.

11 Likes
3 Likes

image

5 Likes

image

When you think about it, this makes perfect sense. Surnames are heritable, and so are likely factors that contribute to longevity. If those who live longer have more children, on average, over time their male offspring, bearing the same surname, will form a larger fraction of the population, resulting in their surnames becoming more frequent.

9 Likes

The crosswalk discriminates and insults the feelings of the color-blind

That’s how it looks to protanopics:
canvas

7 Likes

Looking more closely at the chart in comment #1972, I think the uniformity of the curves between 1930 and 1960 is an artefact of sparse data availability, probably due to World War II and postwar disruption. If you mouse-over the chart on Our World in Data, you’ll see that there are no data for years between 1930 and 1960, which has the result of the plot for every country being a straight line between those two years. This doesn’t mean that public social spending took off simultaneously in 1930, but rather that it grew dramatically between 1930 and 1960, with no idea of when the actual growth occurred. If most of the growth came from relief measures during the Great Depression or instead in the boom years of the 1950s, the chart would look identical.

6 Likes

Since you mention comment #1972, I have to share this page as well:

2 Likes

This phenomenon was discussed here in a comment to a post on 2022-09-15 on “Le Chatelier’s Principle”, citing the “WTF Happened In 1971?” site mentioned in this article, where many more charts are presented which appear to have dramatic inflection points around 1971, and not just in the U.S. but globally.

It’s almost like somebody started messing with the money in which global commerce is conducted and is used for long-term investment in the human future. As that page concludes,

I don’t believe we shall ever have a good money again before we take the thing out of the hands of government, that is, we can’t take it violently out of the hands of government, all we can do is by some sly roundabout way introduce something that they can’t stop.
                                                                            — F.A. Hayek 1984

7 Likes

White lines matter.

4 Likes

Oh the horror, to make someone move around a bit, to earn their keep!
Of course the real horror is when government/culture rewards the inactive life – and gifts from God are not used but buried.
And this goes for individuals, as well as FOR BIG BANKS CORPORATIONS LIKE JP MORGAN – BURIED GIFTS/RESOURCES DESTROY SOCIETIES.

2 Likes

That’s how it looks to protanopics:
canvas

That flag doesn’t look too bad. The color scheme of navy blue, gold, and silver could work for Navy’s football team.

3 Likes

Isn’t 1971 when the world went from a gold backed currency to the petrodollar? At least the globalists’ agenda made that shift in 71 and then carried it out in 72?

5 Likes

They called it “Nixon shock”, 1971-08-15. President not-a-crook said, in a television address from the White House:

We must protect the position of the American dollar as a pillar of monetary stability around the world. In the past 7 years, there has been an average of one international monetary crisis every year… I have directed Secretary Connally to suspend temporarily the convertibility of the dollar into gold or other reserve assets, except in amounts and conditions determined to be in the interest of monetary stability and in the best interests of the United States. Now, what is this action—which is very technical—what does it mean for you? Let me lay to rest the bugaboo of what is called devaluation. If you want to buy a foreign car or take a trip abroad, market conditions may cause your dollar to buy slightly less. But if you are among the overwhelming majority of Americans who buy American-made products in America, your dollar will be worth just as much tomorrow as it is today. The effect of this action, in other words, will be to stabilize the dollar.

How did that stabilisation work out? Well, between July 1971 and July 1981, ten years later, the dollar lost 55.6% of its purchasing power and by April 2023, the dollar lost 86.6% of its value according to the Bureau of Labor Statistics CPI Inflation Calculator.

Well, the man did say, “market conditions may cause your dollar to buy slightly less”. “[P]illar of monetary stability around the world“…heh.

9 Likes